
Daily SD Levels - Indicator
Indicateur
4 achats
Version 1.0, Aug 2025
Windows, Mac
5.0
Avis : 1
Description
Niveaux SD Quotidiens – Bandes d'Écart-Type Dynamiques Basées sur le VWAP
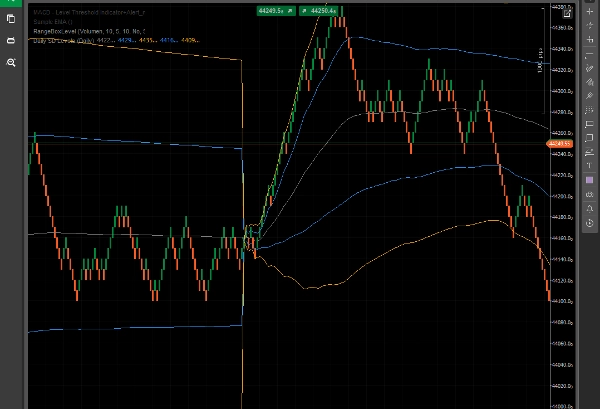
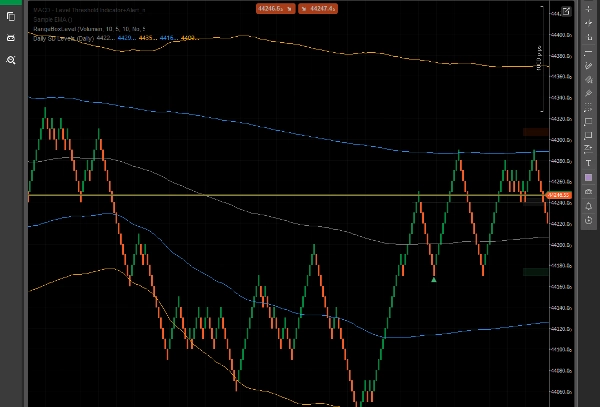
L'indicateur Niveaux SD Quotidiens trace dynamiquement le VWAP (Prix Moyen Pondéré par le Volume) et les Bandes d'Écart-Type (+1/+2 et -1/-2) calculés sur la journée de trading en cours.
Cet outil aide les traders à évaluer visuellement la volatilité intrajournalière, les potentielles zones de support/résistance, et les extrêmes de prix, le tout basé sur le volume réel du marché et l'action des prix – pas sur des niveaux fixes ou arbitraires.
Caractéristiques Clés :
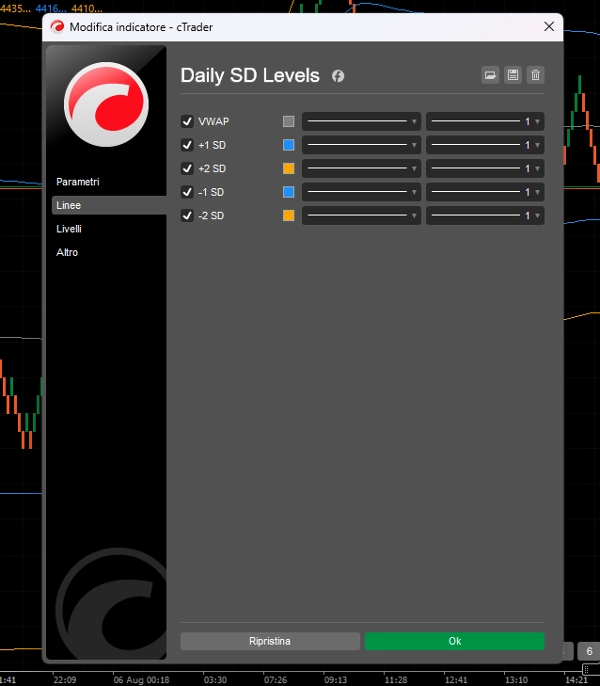
- Ligne VWAP pour le suivi de la juste valeur intrajournalière.
- Bandes SD +1/+2 et -1/-2 pour identifier les zones de surachat/survente.
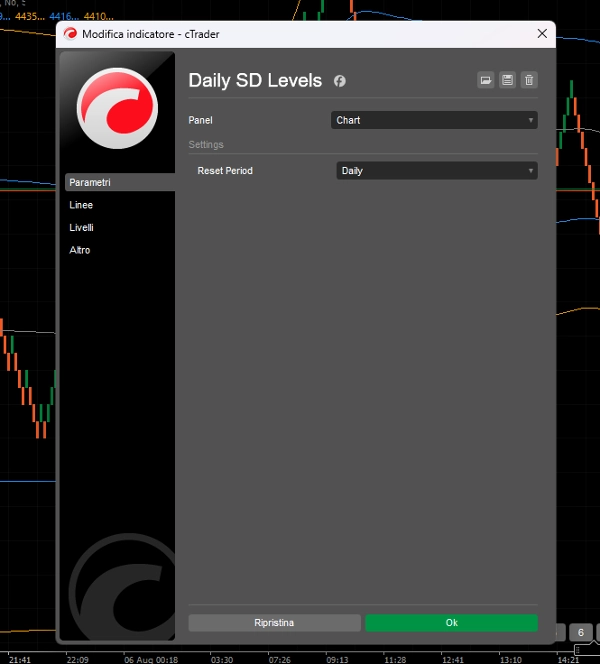
- Les niveaux se réinitialisent quotidiennement, s'adaptant à la dynamique des prix et du volume de chaque session.
- Optimisé pour Renko, Range Bar et le Trading Intrajournalier.
- Conçu pour les traders qui ont besoin de clarté et de zones de prix dynamiques.
Cet indicateur est parfait pour :
- Les configurations de retour à la moyenne.
- Identifier les mouvements étirés pour d'éventuels retournements.
- Confirmation visuelle des cassures au-delà des limites statistiques.
Pas de surcharge. Juste des niveaux propres et réactifs qui évoluent avec le marché.
Résumé
Profil de l'indicateur
Avis clients
5.0
Avis : 1
5 | 100 % | |
4 | 0 % | |
3 | 0 % | |
2 | 0 % | |
1 | 0 % |
Avis clients
August 8, 2025
it gives context without making the decision, but the chart still needs a human read.
Discussion
Questions fréquentes
Les produits disponibles sur cTrader Store, notamment les bots de trading, les indicateurs et les plug-ins, sont fournis par des développeurs tiers et mis à disposition à titre informatif et à des fins d'accès technique uniquement. cTrader Store n'est pas un courtier et ne fournit aucun conseil en investissement, aucune recommandation personnelle ni aucune garantie quant aux performances futures.


Prix
Depuis le 16/07/2025
5
Ventes