
Description
Aperçu
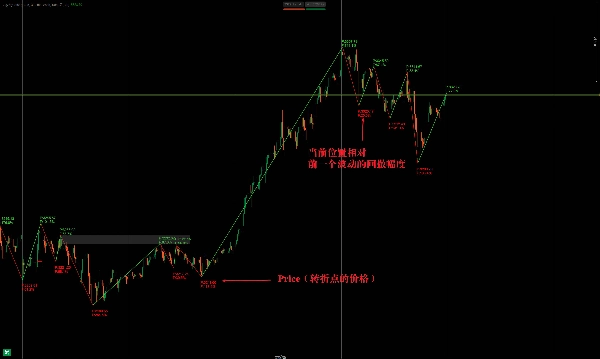
L'indicateur ZigZag est un outil d'analyse technique principalement utilisé pour identifier les points clés de retournement des prix en filtrant le bruit du marché. Il relie les sommets et creux significatifs avec des lignes ZigZag, aidant les traders à visualiser les tendances et les cassures potentielles.
Comment fonctionne ZigZag
- Fonctionnalité principale
-
- Il élimine les fluctuations mineures des prix en définissant un seuil minimum de variation de prix (pourcentage ou valeur fixe).
- Relie uniquement les sommets/creux significatifs, simplifiant l'analyse des tendances.
- Souvent utilisé pour détecter les niveaux de support/résistance, les retournements (ex. tête et épaules, doubles sommets/bas).
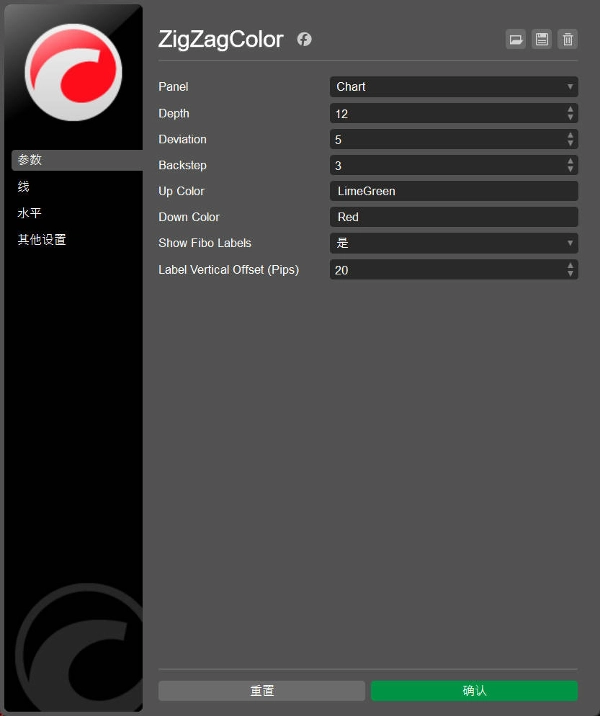
- Paramètres clés
-
- Mouvement minimum du prix (%) : Détermine la sensibilité (ex. 5% ignore les mouvements plus petits).
- Profondeur de retour : Contrôle le nombre de chandeliers passés analysés, affectant le décalage.
Applications principales
1. Identification de tendance
- Tendances haussières : Sommets plus hauts (HH) + creux plus hauts (HL).
- Tendances baissières : Sommets plus bas (LH) + creux plus bas (LL).
- Aide à tracer des lignes de tendance pour des trades potentiels de cassure.
2. Reconnaissance de motifs
- Révèle des motifs graphiques classiques (triangles, drapeaux, coins) en définissant les points de retournement.
3. Niveaux de retracement de Fibonacci
- Marque clairement les sommets/creux pour les extensions ou retracements de Fibonacci.
4. Détection de divergence
- Met en évidence les divergences entre le prix et les oscillateurs (RSI, MACD).
L'indicateur ZigZag est un outil d'analyse technique utilisé principalement pour identifier les points de retournement clés dans les tendances des prix, aidant les traders à filtrer le bruit du marché et à mettre en évidence les sommets et creux importants. Voici ses points clés et son utilisation :
Principe de l'indicateur ZigZag
- Fonctionnalité de base :
-
- En définissant un seuil de variation de prix (pourcentage ou valeur fixe), il ignore automatiquement les petites fluctuations et ne connecte que les sommets et creux significatifs, formant une ligne brisée (forme ZigZag).
- Souvent utilisé pour aider à identifier les niveaux de support/résistance, les retournements de tendance (comme les têtes-épaules, doubles creux, etc.).
- Paramètres clés :
-
- Amplitude minimale de variation (ex. 5% ou points) : détermine la sensibilité au filtrage des petites fluctuations. Plus la valeur est élevée, moins il y a de signaux mais ils sont plus fiables.
- Profondeur de retour : contrôle le nombre de chandeliers pris en compte dans le calcul, influençant le retard des points de retournement.
Utilisations principales
- Identification de tendance :
-
- Détermine la direction de la tendance par des sommets successivement plus hauts (tendance haussière) ou des creux successivement plus bas (tendance baissière).
- Combiné avec des lignes de tendance, il permet de prévoir à l'avance les cassures ou les retracements.
- Analyse de formes :
-
- Identifie les formes classiques de prix (comme les triangles, les drapeaux), les lignes ZigZag affichant clairement les limites des formes.
- Utilisation avec les outils de Fibonacci :
-
- Utilise les sommets/creux marqués par ZigZag comme points de départ/fin pour les retracements ou extensions de Fibonacci.
- Détection de divergences :
-
- Lorsque le prix diverge des indicateurs (comme RSI, MACD), ZigZag aide à confirmer les points de départ et de fin de la divergence.


