
Description
Vitrine :
Indicateur Supertrend – un outil essentiel pour les traders qui facilite le suivi des tendances du marché et permet de prendre des décisions d'investissement plus intelligentes ! Cet indicateur intuitif et de qualité professionnelle est conçu pour fournir des signaux d'achat et de vente clairs comme le cristal, que vous débutiez ou que vous soyez un investisseur expérimenté.
Pourquoi choisir l'indicateur Supertrend ?
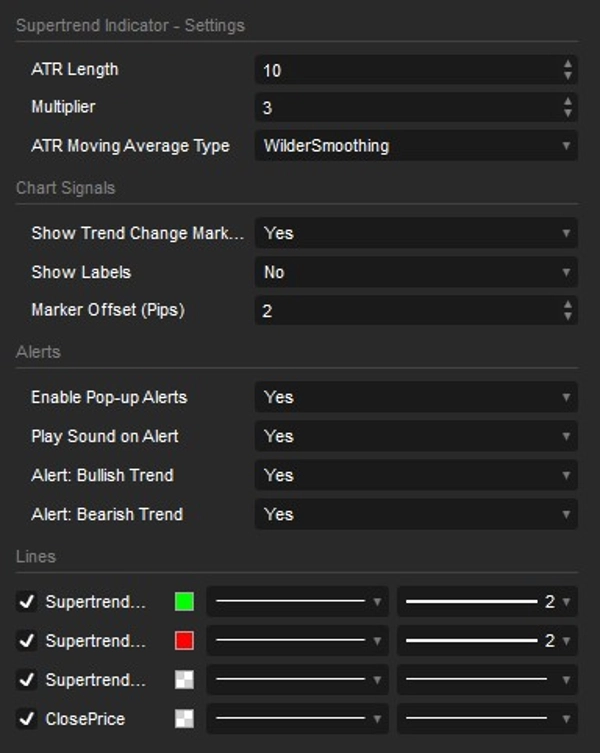
- Précision standard de l'industrie : Maintenant avec des types de moyenne mobile ATR personnalisables (y compris le lissage de Wilder). Il calcule et réagit exactement comme les versions premium Supertrend les plus populaires que l'on trouve sur les meilleures plateformes de graphiques comme TradingView !
- 100 % sans recalcul : Construit avec un mécanisme de mémoire de tendance solide comme un roc. Une fois qu'une tendance change et qu'un signal est affiché, il reste là. Pas de recalcul, pas de flèches disparues, et pas d'erreurs de recalcul lors du défilement dans l'historique des graphiques.
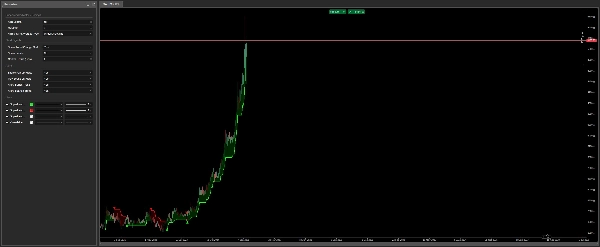
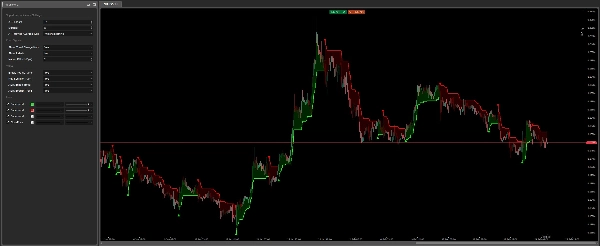
- Simplicité et efficacité : L'indicateur trace automatiquement une ligne Supertrend qui devient verte lorsque le marché monte (signal d'achat) et rouge lorsqu'il descend (signal de vente). Vous saurez toujours exactement dans quelle direction la tendance se dirige.
- Notifications intelligentes en temps réel : Ne manquez jamais une opportunité de trading ! L'indicateur dispose d'un système d'alerte amélioré utilisant les pop-ups natifs de cTrader et des effets sonores intégrés. De plus, avec une protection anti-spam intégrée, vous êtes alerté exactement une fois lorsqu'un signal en temps réel se produit — pas de spam sonore ennuyeux lors du chargement ou du rechargement des graphiques.
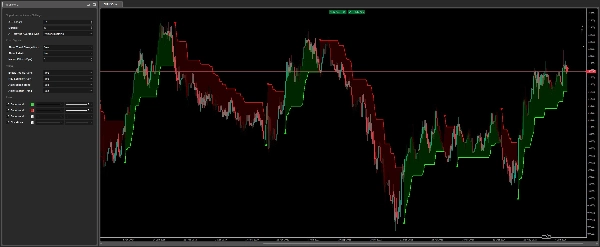
- Signaux visuels améliorés & remplissage nuageux : À chaque changement clé de tendance, vous verrez des flèches accrocheuses et des étiquettes de texte optionnelles "Haussier"/"Baissier". Un remplissage nuageux subtil et dynamique entre la ligne Supertrend et le prix vous aide à saisir facilement l'élan du marché d'un coup d'œil.
- Entièrement personnalisable & précis : Ajustez facilement les paramètres de base comme la longueur ATR et le multiplicateur. Vous pouvez également contrôler précisément la distance des flèches et des étiquettes en utilisant des décalages dynamiques basés sur les pips, garantissant des visuels parfaits et dégagés sur n'importe quel actif.
Indicateur Supertrend est parfait pour toute personne cherchant à simplifier l'analyse du marché – des traders débutants cherchant un moyen facile de repérer les tendances, aux professionnels expérimentés souhaitant des signaux très précis et sans recalcul pour leurs stratégies. Il fonctionne parfaitement sur tous les marchés – Forex, Actions, Indices, Cryptomonnaies – et sur toutes les périodes.
Résumé
Avis clients
5 | 33 % | |
4 | 67 % | |
3 | 0 % | |
2 | 0 % | |
1 | 0 % |


