
Description
Market Cipher A est un indicateur technique avancé conçu pour une analyse facile, l'identification et la prédiction des tendances macro sur le marché des cryptomonnaies.
Structure et composants
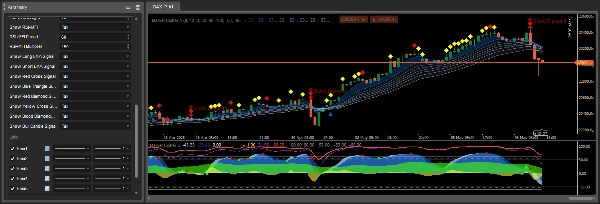
Market Cipher A se compose d'un ruban de 8 moyennes mobiles exponentielles (EMA) qui changent de couleur selon la tendance du marché. Le ruban EMA devient bleu ou blanc pendant un marché haussier et gris pendant un marché baissier.
Par défaut, les moyennes mobiles avec des valeurs EMA de 5 à 34 sont utilisées. Les croisements de ces lignes peuvent être des indicateurs retardés très puissants, c'est pourquoi Market Cipher A a été programmé pour afficher automatiquement des symboles correspondant à différents signaux, éliminant ainsi le besoin d'interprétation manuelle de chaque croisement haussier ou baissier.
Symboles et signaux de trading
Market Cipher A affiche des symboles caractéristiques directement sur le graphique en chandeliers qui indiquent des opportunités potentielles de trading :
Triangle bleu - signal de renversement de tendance, indique un ralentissement de la dynamique et un renversement imminent. C'est un avertissement précoce que la dynamique de la tendance diminue.
Cercle vert - indicateur haussier, le plus fiable sur des périodes de 6 heures et plus. Apparaît généralement après un triangle bleu et doit être interprété dans un intervalle de 1 à 3 chandeliers.
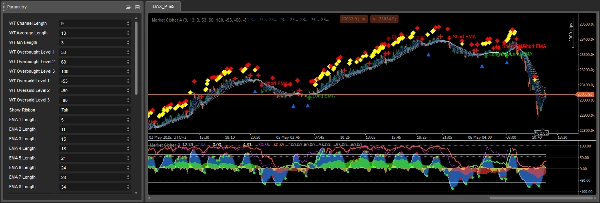
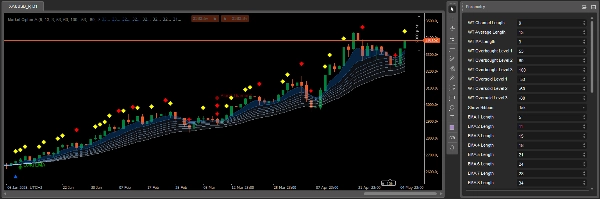
Losanges jaunes - indiquent la continuation d'une tendance haussière. Doivent être utilisés conjointement avec le ruban EMA pour une meilleure confirmation de la direction de la tendance.
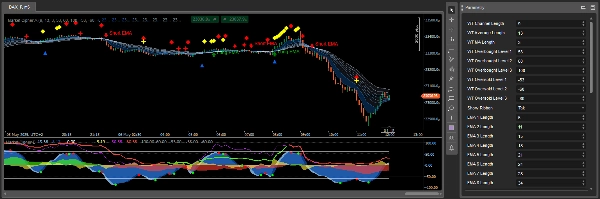
Losanges rouges - signalent un affaiblissement de la tendance et une possible continuation à la baisse. Indiquent une augmentation de la dynamique baissière.
X rouge - indicateur baissier, le plus efficace sur des périodes de 1 heure et plus. Doit être utilisé conjointement avec le ruban EMA et le losange rouge.
X jaune - indique une manipulation du marché, en particulier une couverture importante de positions longues rapidement achetées puis vendues par des positions courtes.
Grand losange rouge (Blood Diamond) - le signal le plus baissier, indiquant une forte probabilité de baisse, surtout lorsqu'il apparaît avec un X rouge ou un losange rouge plus petit.
Principes d'utilisation
Market Cipher A fournit un support ou une résistance mathématique forte visuellement, permettant une compréhension facile de l'environnement de trading. Il fonctionne mieux avec les chandeliers Heiken Ashi.
Le ruban EMA indique non seulement la tendance mais agit aussi comme des niveaux dynamiques de support et de résistance. Lorsque le ruban est bleu/blanc et que les chandeliers sont au-dessus, vous pouvez chercher des opportunités pour prendre des positions longues. Lorsque le ruban est gris et que les chandeliers sont en dessous, vous pouvez envisager des positions courtes.
Les meilleurs résultats sont obtenus lorsque les signaux de Market Cipher A sont combinés avec d'autres indicateurs du package Market Cipher, en particulier Market Cipher B, qui fournit des signaux supplémentaires de momentum et des points d'entrée.
Interprétation détaillée des signaux dans le contexte de la tendance
Un aspect important de Market Cipher A est l'interprétation contextuelle des signaux selon la tendance dominante. Lorsque le ruban change de couleur du gris au bleu, l'indicateur génère un cercle vert comme signal du début d'une tendance haussière. Normalement, après un cercle vert, si les 1 à 3 chandeliers suivants affichent un losange jaune, la probabilité d'une cassure est élevée. Cependant, si des losanges rouges apparaissent, une cassure est moins probable.
Pendant un marché haussier, les losanges jaunes sont favorables, montrant une continuation à la hausse conforme à la tendance, tandis que les losanges rouges représentent un mouvement contre-tendance. En marché baissier, la situation est inversée - les losanges rouges sont favorables comme continuation de la baisse, et les losanges jaunes indiquent un mouvement temporaire à la hausse contraire à la tendance.
Le X rouge est le plus fiable lorsqu'il apparaît après un losange rouge et que le ruban EMA est presque complètement resserré, changeant de couleur en gris baissier. La précision de cet indicateur varie selon la période temporelle.
Mécanisme de fonctionnement et genèse des signaux
Les symboles et signaux dans Market Cipher A sont générés à partir de plusieurs sources : croisements d'ondes WaveTrend, niveaux de surachat et de survente, et basés sur le RSI et le MFI lorsqu'ils croisent la ligne centrale ou atteignent des conditions de surachat et de survente. Cette analyse multidimensionnelle rend les signaux plus complets que les indicateurs uniques.
Le ruban EMA est composé de 8 moyennes mobiles formant un ruban caractéristique avec une séparation entre les bandes individuelles. La séparation des bandes est un facteur important - une large séparation indique une tendance forte, tandis que des bandes resserrées suggèrent un affaiblissement de la dynamique ou une consolidation.
Application pratique dans les stratégies de trading
Market Cipher A a été conçu principalement comme un outil d'analyse de tendance, il fonctionne donc mieux dans des stratégies suivant la tendance. Il est recommandé d'utiliser le ruban conjointement avec d'autres indicateurs d'identification de tendance, puis de rechercher des opportunités de trading lors des replis de prix.
Il est important de se rappeler que ces signaux aident à affiner le timing d'entrée ou de sortie des trades, mais ne doivent pas être utilisés seuls pour prendre des décisions de trading. Des confirmations supplémentaires sont nécessaires, en particulier pour les signaux de renversement qui surviennent lors de mouvements plats des prix.
Résumé
The indicator automatically displays distinct symbols on the price chart to signal potential trading opportunities:
- Blue Triangle: signals declining momentum and possible trend reversal.
- Green Circle: indicates a bullish trend start, most reliable on 6-hour timeframes and above.
- Yellow Diamonds: suggest continuation of an upward trend.
- Red Diamonds: indicate trend weakening and potential downward continuation.
- Red X: bearish signal effective on 1-hour timeframes and higher.
- Yellow X: points to market manipulation events.
- Large Red Diamond ("Blood Diamond"): strong bearish signal with high probability of decline.
Signals are generated using a combination of WaveTrend crossovers, RSI, and MFI indicators, providing multidimensional market analysis. Market Cipher A is optimized for use with Heiken Ashi candles and is best applied within trend-following strategies, ideally combined with other Market Cipher indicators for enhanced entry and momentum confirmation.
Avis clients
5 | 67 % | |
4 | 33 % | |
3 | 0 % | |
2 | 0 % | |
1 | 0 % |


