
الوصف
💡 قنوات الانحدار الخطي ونقاط زيغزاغ 💡
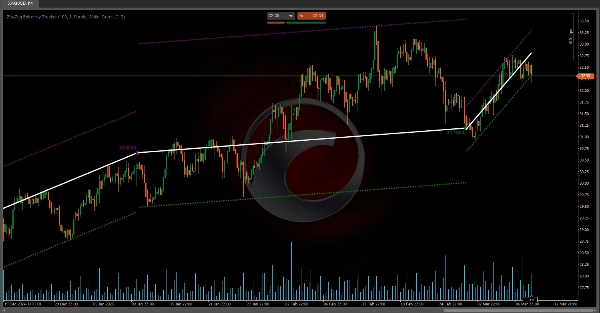
• يتم إعادة حساب قنوات الانحدار الخطي وإعادة تعيينها في كل مرة يتحرك فيها السعر خارج الحدود المتوقعة (الأشرطة)، مما يضمن بقاء القياس محدثًا مع الاتجاه الحقيقي للسوق.
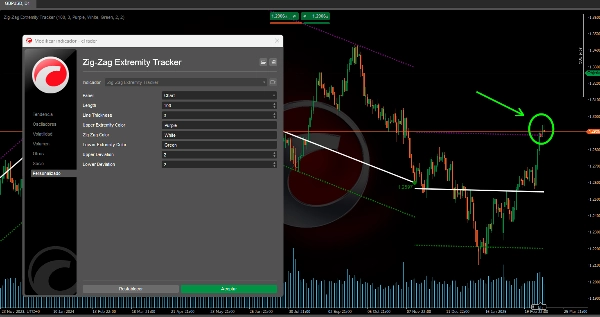
• النقاط المحددة (الدوائر) تمثل القمم والقيعان التي تُستخدم كأساس لرسم زيغزاغ وتحديد من أين تُحسب القنوات.
• تسمح هذه الطريقة الديناميكية برؤية أفضل للتغيرات المحتملة في الاتجاه، وكذلك مناطق الإفراط في الشراء أو البيع حيث قد يعود السعر نحو المتوسط.
❓ كيف ترتبط القنوات بزيغزاغ والنقاط القصوى؟ ❓
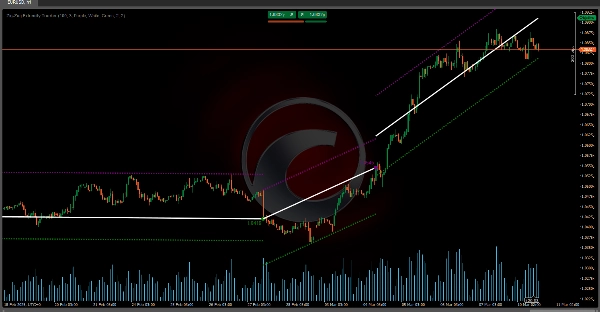
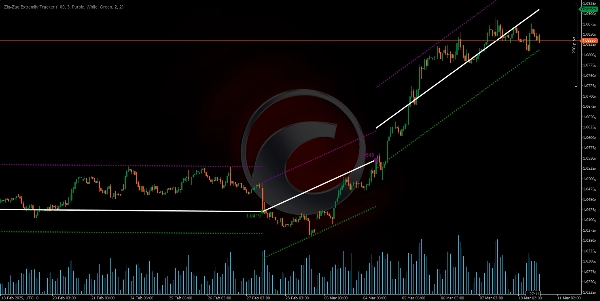
• كلما تم اكتشاف قمة أو قاع جديد، لا يقوم المؤشر فقط برسم دائرة وخط زيغزاغ يربط تلك النقطة بالنقطة السابقة، بل يعيد أيضًا ضبط قناة الانحدار الخطي المحتملة التي تُرسم من تلك القمة أو القاع الأخيرة.
• إذا بقي السعر ضمن الأشرطة خلال الأعمدة التالية، تظل القناة نشطة وتمتد إلى العمود الحالي.
• إذا كسر السعر تلك الأشرطة في أي وقت، يفترض المؤشر أن القناة قد تم إبطالها ويبدأ قناة جديدة من العمود الذي حدث فيه الكسر.
مؤشرات متجر Ctrader:
هيكل السوق الديناميكي
تحليل نقاط التحول
انحدار فيبوناتشي الخطي
انحدار متعدد الأطر الزمنية
انحياز الشمعة متعددة المستويات
المتعقب
خطوط دعم ومقاومة تلقائية
خطوط الاتجاه
جميع مستويات الدعم والمقاومة
المستويات
تحليل هيكل السوق الديناميكي لنقاط التحول
انحدار فيبوناتشي الخطي متعدد الأطر الزمنية
متعقب انحياز الشمعة متعددة المستويات
الملخص
تقييمات العملاء
5 | 50 % | |
4 | 50 % | |
3 | 0 % | |
2 | 0 % | |
1 | 0 % |


