
Description
Présentation de Stochastic RSI PRO pour cTrader, une version avancée et hautement personnalisable de l'indicateur Stochastic RSI conçue pour améliorer votre précision en trading.
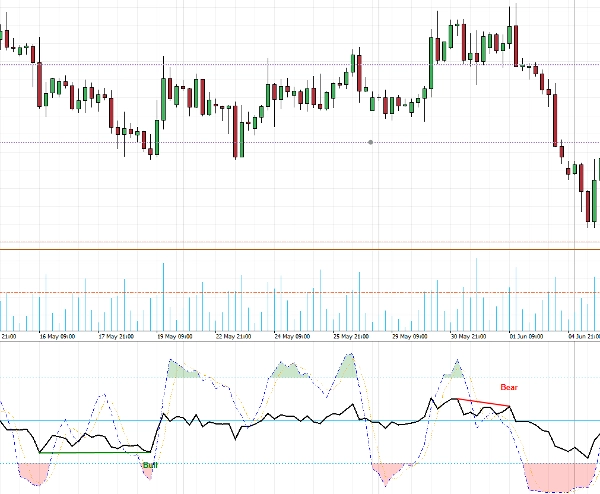
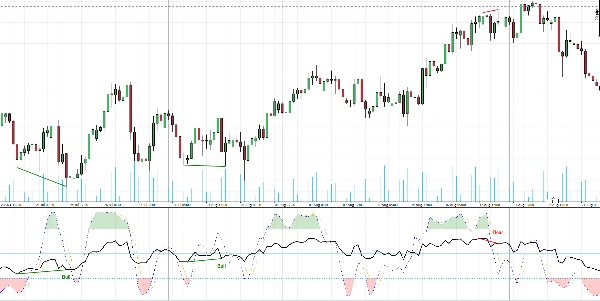
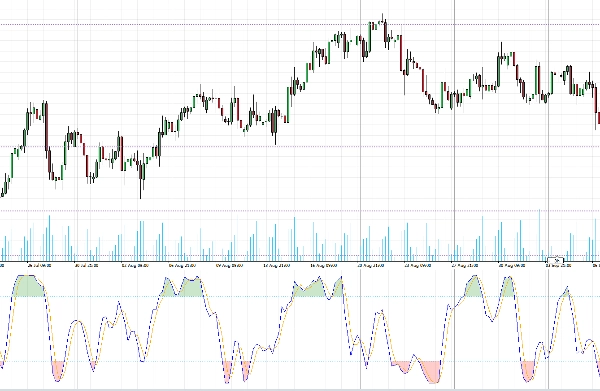
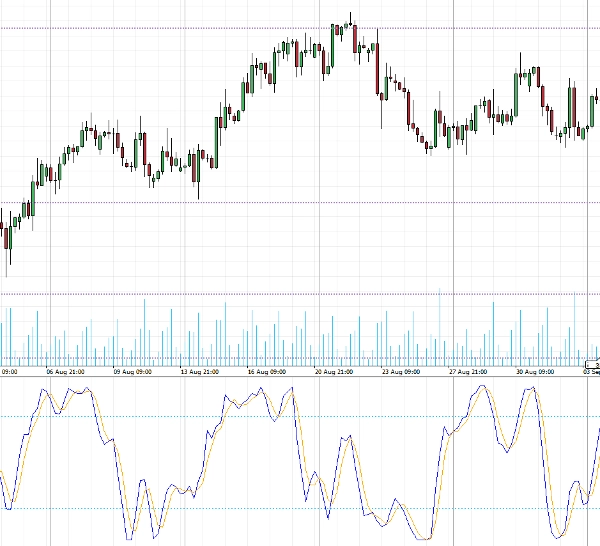
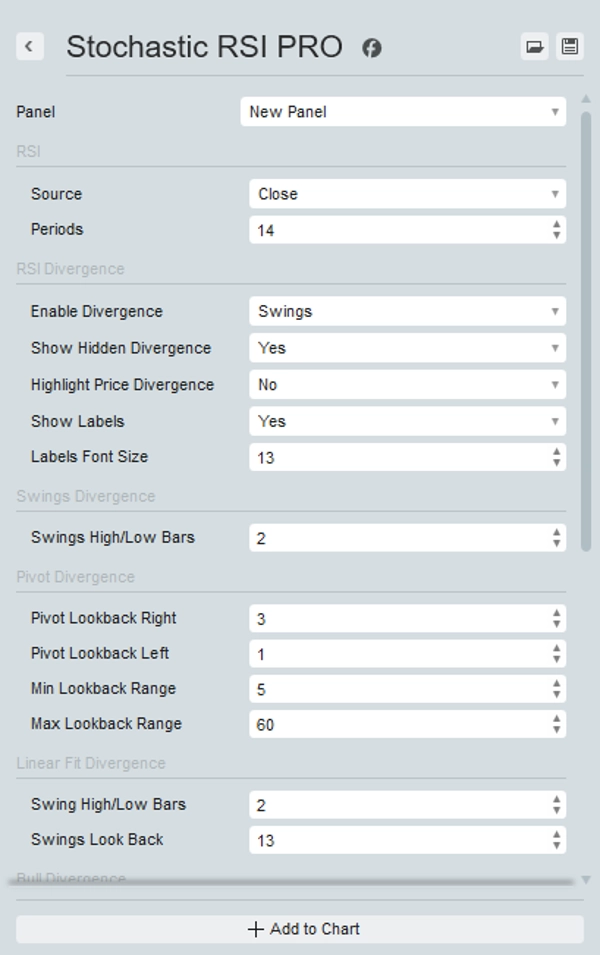
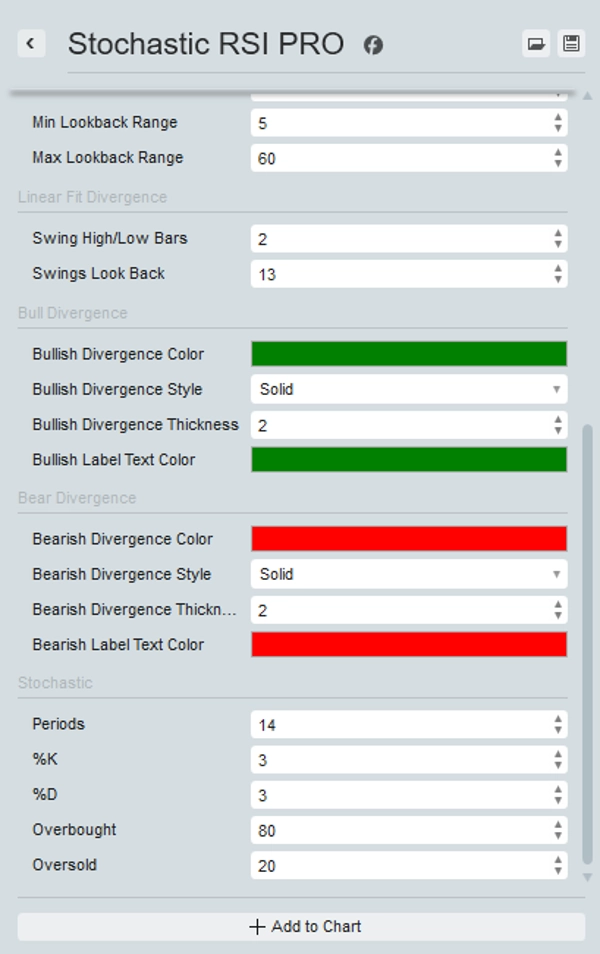
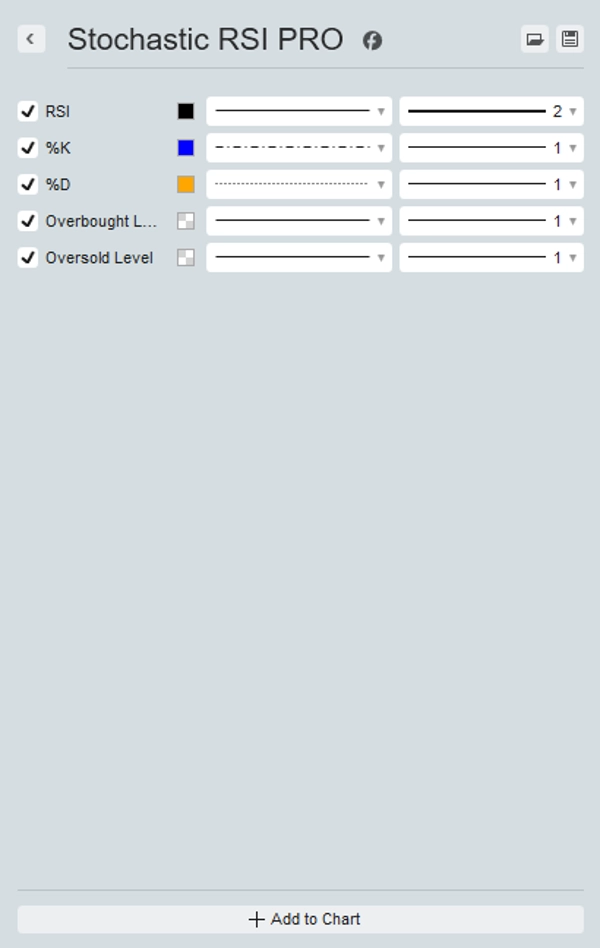
Cet outil puissant superpose le RSI directement sur le Stochastic RSI, offrant une vue complète du momentum du marché. Il met en évidence les zones de surachat et de survente avec des couleurs distinctes pour une identification facile.
La caractéristique principale de Stochastic RSI PRO est sa capacité à identifier et, en option, à mettre en évidence à la fois les divergences régulières et cachées sur le graphique. Vous pouvez choisir parmi trois méthodes pour identifier les divergences : Swing, Pivot, ou Linear Fit, chacune avec des réglages personnalisables pour correspondre à votre stratégie de trading.
Améliorez votre analyse et votre prise de décision avec Stochastic RSI PRO, un outil indispensable pour les traders avertis.
Résumé
Avis clients
5 | 75 % | |
4 | 25 % | |
3 | 0 % | |
2 | 0 % | |
1 | 0 % |


