
Description
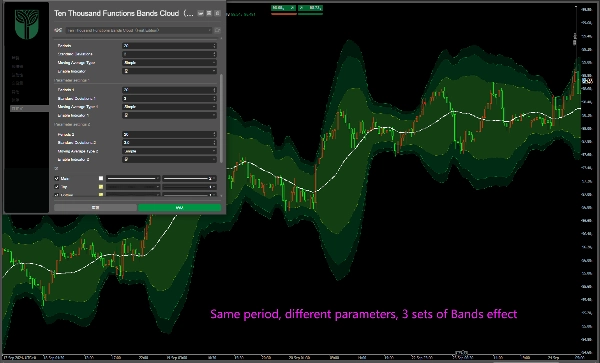
3 groupes réguliers de bandes :
période : 20
Déviations : 2.0 ; 3.0 ; 3.5 ;
Doté d'un fond nuageux !
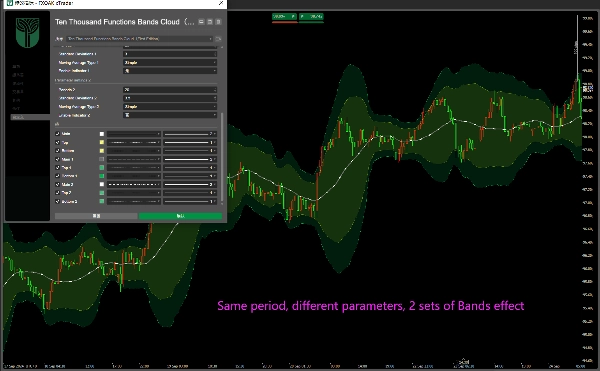
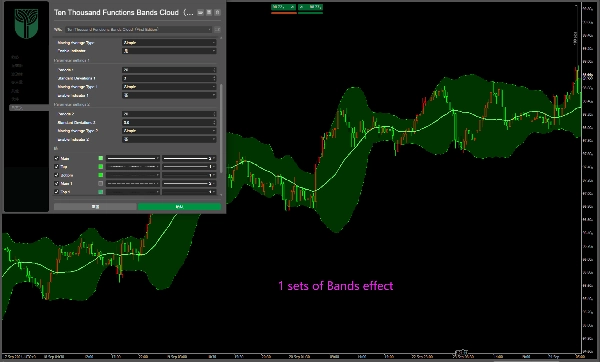
Vous pouvez fermer ou ouvrir un ou deux groupes ; et différents paramètres peuvent être modifiés et réglés !
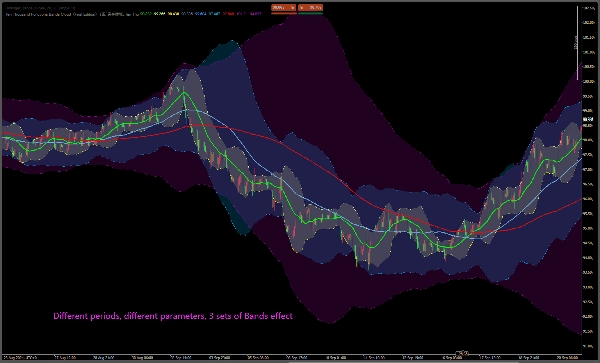
Il peut également être modifié à d'autres valeurs, telles que 2.0 : 20, 60, 144 bandes ;
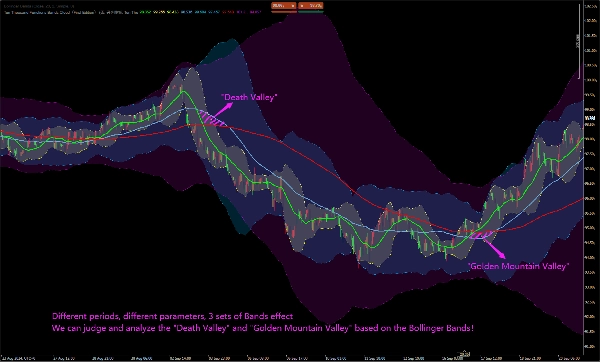
La piste médiane des bandes est égale à la moyenne mobile, qui est la moyenne mobile à 20, 60 et 144 !
Nous pouvons juger et analyser la "Vallée de la Mort" et la "Vallée de la Montagne d'Or" en fonction de la piste médiane des bandes de Bollinger !
常规3组Bands:
周期:20
偏差:2.0;3.0; 3.5;
支持云背景!
您可以关闭或打开任意一个或两个组;并且可以修改和设置不同的参数!
它也可以修改为其他值,如2.0:20、60、144布林带;
Bands中轨等于移动平均线,即20、60和144移动平均线!
我们可以根据布林中轨迹来判断和分析“死亡谷”和“金山谷”等......
標準3グループボリンジャーバンド(Bands):期間:20;偏差値:2.0;3.0;3.5;クラウドバックグラウンドに対応!任意の1グループまたは2グループをオン/オフ設定することが可能です。また、各パラメーターの修正と設定も行えます。他の数値に変更することも可能です。例えば2.0の偏差値で、期間20、60、144のボリンジャーバンドに設定するなど。ボリンジャーバンドの中線は移動平均線に等しく、すなわち期間20、60、144の移動平均線です。ボリンジャーバンドの中線に基づいて、「デッドバレー(死亡谷)」や「ゴールドバレー(金山谷)」などを判断・分析することができます。
Стандартные 3 группы Бандов (Полос Боллинджера): Период: 20; Отклонение: 2,0; 3,0; 3,5; Поддержка облачного фона! Вы можете отключить или включить любую одну или две группы; кроме того, вы можете изменять и настраивать различные параметры! Его также можно изменить на другие значения, например, Боллинджеры с отклонением 2,0 и периодами 20, 60, 144; Средняя линия Бандов равна скользящей средней, то есть скользящим средним с периодами 20, 60 и 144! Мы можем определять и анализировать такие явления, как «Мёртвая долина» и «Золотая долина», на основе средней линии 。
Résumé
Avis clients
5 | 100 % | |
4 | 0 % | |
3 | 0 % | |
2 | 0 % | |
1 | 0 % |


![Logo de "High-Low Divergence [Iridio Capital]"](https://cdn.ctrader.com/image/webp/443c4661-7abb-40f1-842f-4b6ec560649b_40914)


