
Description
🌊 Tsunami Volume Surge (RVOL + Time-of-Day) est un outil de volume de précision pour cTrader qui vous montre quand le marché est vraiment actif.
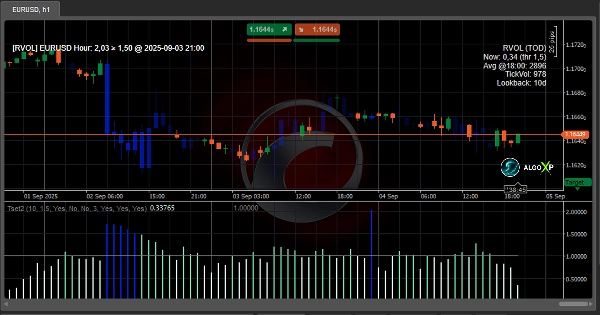
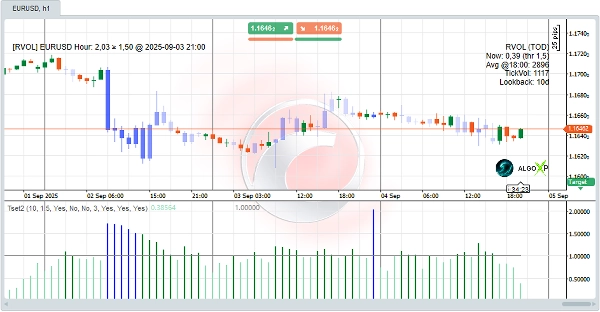
Plutôt que de regarder le volume brut, Tsunami compare l’activité de chaque barre à la moyenne à la même heure de la journée sur vos Jours de Rétroaction choisis. Cette normalisation selon l’heure de la journée révèle de véritables pics de participation que vous pouvez trader : considérez 1.0 comme “normal,” utilisez 1.5–2.0 pour confirmer les cassures, et surveillez 3.0+ pour des mouvements explosifs liés aux actualités. Un histogramme RVOL clair, une coloration dynamique des chandeliers, et des alertes & pop-ups rendent l’énergie évidente en un coup d’œil - léger et rapide sur M1–M15 sur FX, crypto, et indices. Les valeurs RVOL peuvent aussi alimenter vos cBots comme un filtre simple et robuste.
Explorez plus de ressources et une FAQ détaillée sur AlgoXP
⚡ Comment trader avec (démarrage rapide)
- Ajoutez Tsunami sur votre graphique (M1–M15 fonctionne très bien). Réglez Jours de Rétroaction (commencez avec 20–30).
- Gardez Baseline 1.0 visible. RVOL < 1.0 = calme ; ≥ 1.5–2.0 = confirmer les cassures ; ≥ 3.0 = pic d’actualité.
- Activez Activer les alertes et choisissez Alerte uniquement à la clôture (plus sûr) ou intrabar (plus rapide).
- Utilisez Coloriser les barres pour une lecture instantanée de l’énergie ; ajustez Couleur des barres selon vos goûts.
- (Optionnel) Dans cBots, lisez la série RVOL pour filtrer les signaux vers les fenêtres actives uniquement.
🚀 Résultat : Tsunami transforme le volume en un avantage conscient du temps - vous aidant à éviter les périodes mortes, confirmer les vraies cassures, et réagir plus rapidement quand le marché s’éveille.
Résumé
Key features include an RVOL histogram, dynamic candle coloring for quick visual assessment, and customizable alerts with pop-ups. It operates efficiently on short timeframes (M1 to M15) and supports multiple markets such as Forex, cryptocurrencies, indices, commodities, and stocks. Additionally, RVOL values can be integrated into cBots as filters to refine automated trading signals.
The indicator aims to provide a time-aware volume edge, enabling traders to avoid low-activity periods, confirm breakouts, and respond promptly to market surges. Users can adjust settings like lookback days, alert preferences, and bar colors to tailor the tool to their trading style.
Avis clients
5 | 67 % | |
4 | 33 % | |
3 | 0 % | |
2 | 0 % | |
1 | 0 % |


