
HTFBB
Chỉ báo
1 lượt mua
Phiên bản 1.0, Jul 2025
Windows, Mac
5.0
Đánh giá: 1
Mô tả
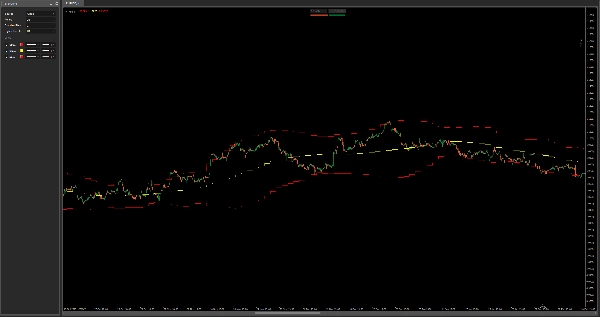
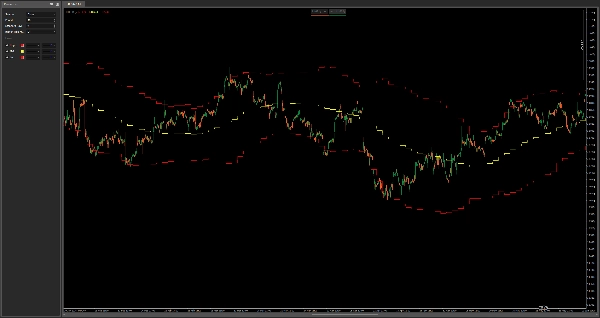
HTF Bollinger Bands – Bản đồ biến động đa khung thời gian
Chỉ báo này vẽ Dải Bollinger từ khung thời gian cao hơn lên biểu đồ hiện tại của bạn, cung cấp cho bạn bối cảnh mạnh mẽ về biến động, hồi quy trung bình và hỗ trợ/kháng cự động—tất cả mà không cần chuyển đổi khung thời gian.
Tính năng:
- Hiển thị dải Bollinger trên, giữa và dưới từ bất kỳ khung thời gian cao hơn nào có thể chọn
- Tuyệt vời để phát hiện vùng tích lũy HTF, áp lực bứt phá, và điều chỉnh xu hướng
- Lý tưởng cho việc lướt sóng và vào lệnh trong ngày với nhận thức về khung thời gian cao hơn
- Hoạt động trên tất cả tài sản và khung thời gian
Kết hợp với chiến lược hiện tại của bạn để tránh giao dịch vào các bẫy biến động và duy trì sự phù hợp với cấu trúc giá vĩ mô.
Tóm tắt
Hồ sơ chỉ báo
Đánh giá của khách hàng
5.0
Đánh giá: 1
5 | 100 % | |
4 | 0 % | |
3 | 0 % | |
2 | 0 % | |
1 | 0 % |
Đánh giá của khách hàng
July 29, 2025
confusing signals get easier to ignore, but a clean signal can still fail.
Thảo luận
Câu hỏi thường gặp
Các sản phẩm có sẵn trên cTrader Store, bao gồm bot giao dịch, chỉ báo và plugin, được cung cấp bởi các nhà phát triển bên thứ ba và chỉ nhằm mục đích cung cấp thông tin và tiếp cận kỹ thuật. cTrader Store không phải là nhà môi giới và không cung cấp lời khuyên đầu tư, khuyến nghị cá nhân hay bất kỳ đảm bảo nào về hiệu suất trong tương lai.


Giá
Kể từ 03/01/2025
638.03K
Khối lượng đã giao dịch
21.34K
Pip đạt được
15
Lượt bán