
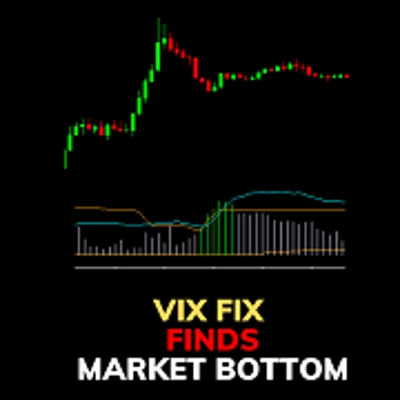
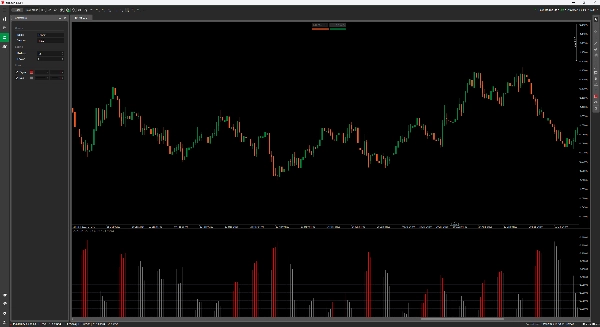
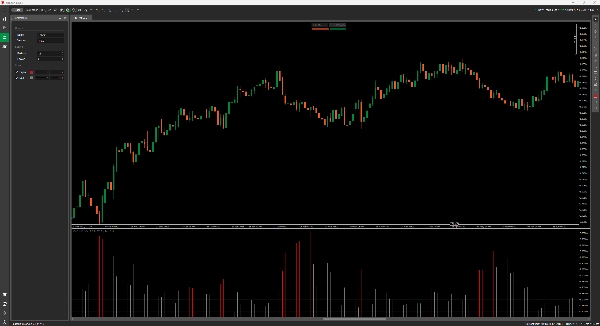
설명
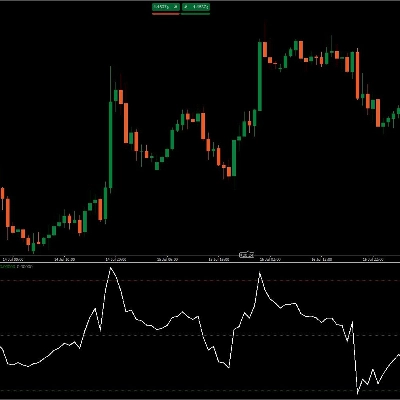
cTrader용 VixFix 지표
뉴스가 나오기 전에 시장 공황을 포착하세요.
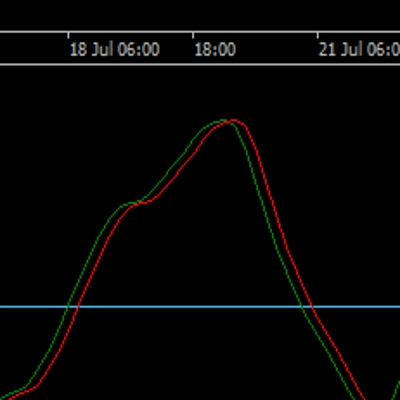
이 VixFix 지표는 Larry Williams의 고전적인 “VIX Fix” 개념을 스마트하게 적용한 것으로—특히 잠재적 시장 바닥을 식별하는 데 유용한 단기 공포와 변동성 급증을 탐지하는 데 도움을 줍니다.
작동 방식
- 최근 저점과 구성 가능한 기간(기본값: 12) 동안의 최고 고점을 비교하여 의사 변동성 급증을 계산합니다.
- 이동 평균과 표준 편차 범위를 적용하여 신호 급증을 정상 잡음과 구분합니다.
- 변동성이 임계값을 초과할 때 빨간색 히스토그램 막대를 표시하여 주의를 기울여야 함을 알립니다.
특징
- 깔끔한 히스토그램 표시(오버레이 아님)
- 두 가지 색상 플롯:
-
- 빨간색 = 신호 (임계값을 초과하는 변동성 급증)
- 회색 = 정상 활동
- 조정 가능한 기간 및 민감도 계수
- 제로 지표 지연—원시 가격 동작만 사용하며, 재도색 없음
사용 사례
- 하락 추세에서 잠재적 반전을 포착
- 평균 회귀 거래의 타이밍
- RSI나 기타 지연 도구에 의존하지 않고 과매도 상태를 확인
요약
AI summary
The VixFix indicator for cTrader is a volatility spike detector based on Larry Williams’ VIX Fix concept. It identifies short-term market fear and volatility surges, which can signal potential market bottoms. The indicator calculates a pseudo-volatility spike by comparing recent lows to the highest highs over a configurable period (default 12). It then applies a moving average and standard deviation envelope to distinguish significant volatility spikes from normal market noise.
The output is displayed as a clean, non-overlay histogram with two colors: red bars indicate volatility spikes above the threshold, signaling heightened market fear, while gray bars represent normal activity. Users can adjust the periods and sensitivity factor to tailor the indicator to their trading preferences. The indicator uses raw price data without repainting, ensuring zero lag.
Typical use cases include spotting potential reversals in downtrends, timing mean-reversion trades, and confirming oversold conditions without relying on lagging indicators like RSI. The VixFix indicator provides a clear visual tool to monitor volatility spikes and market panic moments for more informed trading decisions.
지표 프로필
고객 리뷰
4.5
리뷰: 4
5 | 50 % | |
4 | 50 % | |
3 | 0 % | |
2 | 0 % | |
1 | 0 % |
고객 리뷰
August 3, 2025
July 24, 2025
A small forward sample keeps the opinion honest, and the entry gets a useful pause.
July 24, 2025
상담
자주 묻는 질문(FAQ)
트레이딩 봇, 지표, 플러그인 등 cTrader Store에서 제공되는 상품은 제3자 개발자에 의해 제공되며, 이는 단순히 정보 및 기술적 접근을 목적으로 제공된 것입니다. cTrader Store는 중개인이 아니며, 투자 조언, 개인별 추천 또는 향후 성과에 대한 어떠한 보장도 제공하지 않습니다.










가격
가입일 03/01/2025
638.03K
거래량
21.34K
핍 수익
19
판매