
SupertrendChannels
Chỉ báo
Phiên bản 1.0, Jul 2025
Windows, Mac
4.5
Đánh giá: 2
Mô tả
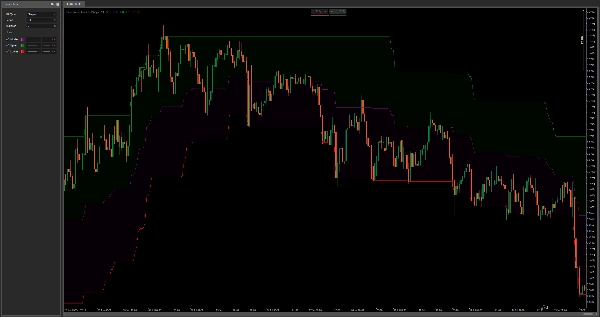
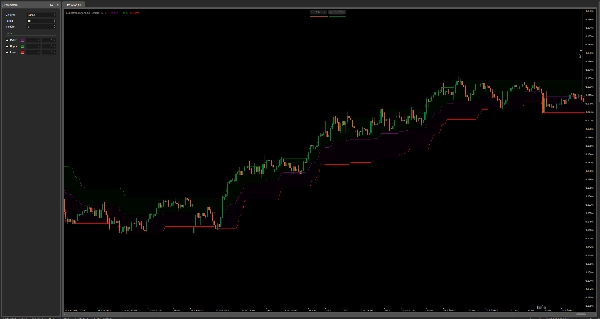
Kênh Supertrend là một chỉ báo phủ tùy chỉnh được thiết kế để giúp các nhà giao dịch nhận biết trực quan vùng hỗ trợ và kháng cự động, tín hiệu vào lệnh, và mức dừng lỗ theo sau sử dụng logic dựa trên ATR.
Chỉ báo vẽ ba đường:
- Dải trên (Màu xanh lá) – đóng vai trò như kháng cự động hoặc dừng lỗ theo sau cho các giao dịch mua.
- Dải dưới (Màu đỏ) – đóng vai trò như hỗ trợ động hoặc dừng lỗ theo sau cho các giao dịch bán.
- Đường giữa (Màu tím) – phục vụ như mức hồi quy trung bình hoặc điểm vào lệnh tiềm năng.
Nó tính toán các dải bằng cách sử dụng Average True Range (ATR) nhân với một hệ số do người dùng định nghĩa (Multiplier) và cộng/trừ giá trị đó vào mức cao/thấp của nến hiện tại. Một phương pháp làm mượt (loại MA có thể chọn) được áp dụng cho ATR để điều chỉnh độ nhạy.
Cách sử dụng:
- Vào lệnh: Tìm điểm vào lệnh gần đường giữa trong các giai đoạn tích lũy hoặc sau các tín hiệu cắt nhau.
- Dừng lỗ theo sau: Sử dụng dải trên/dải dưới như các vùng thoát lệnh động để khóa lợi nhuận khi xu hướng kéo dài.
- Hỗ trợ & Kháng cự: Các dải này hoạt động như các vùng thích ứng phản ánh biến động gần đây và giúp phát hiện các điểm đảo chiều tiềm năng.
Không giống như Bollinger Bands tiêu chuẩn, phương pháp này neo các dải dựa trên cực giá cộng với biến động, không phải trung bình động, làm cho nó nhạy hơn trong môi trường xu hướng và linh hoạt hơn cho giao dịch tùy ý hoặc thuật toán.
Tóm tắt
Hồ sơ chỉ báo
Đánh giá của khách hàng
4.5
Đánh giá: 2
5 | 50 % | |
4 | 50 % | |
3 | 0 % | |
2 | 0 % | |
1 | 0 % |
Đánh giá của khách hàng
July 26, 2025
the idea is fine, just do not expect it to print perfect entries. Win rate means less without average R.
July 25, 2025
The reason it feels usable is the plan does not get lost as quickly. The market context still matters.
Thảo luận
Câu hỏi thường gặp
Các sản phẩm có sẵn trên cTrader Store, bao gồm bot giao dịch, chỉ báo và plugin, được cung cấp bởi các nhà phát triển bên thứ ba và chỉ nhằm mục đích cung cấp thông tin và tiếp cận kỹ thuật. cTrader Store không phải là nhà môi giới và không cung cấp lời khuyên đầu tư, khuyến nghị cá nhân hay bất kỳ đảm bảo nào về hiệu suất trong tương lai.


Giá
Kể từ 03/01/2025
638.03K
Khối lượng đã giao dịch
21.34K
Pip đạt được
15
Lượt bán