
Mô tả
Hướng Dẫn Sử Dụng WinSMC
1. Mục Đích
`WinSMC` là một chỉ báo SMC phủ lên cTrader. Nó giúp bạn nhận biết trực quan:
- Sự thay đổi cấu trúc thị trường
- `BOS` (Phá Vỡ Cấu Trúc)
- `MSS` (Thay Đổi Cấu Trúc Thị Trường)
- `Order Blocks` (Khối Lệnh)
- `Liquidity Grabs` / `Sweeps` (Thu Hút Thanh Khoản / Quét)
- `FVG` (Khoảng Trống Giá Trị Công Bằng)
Nó không phải là một hệ thống giao dịch tự động. Đây là một công cụ dựa trên cấu trúc và ngữ cảnh, phù hợp nhất để giao dịch dựa trên xác nhận.
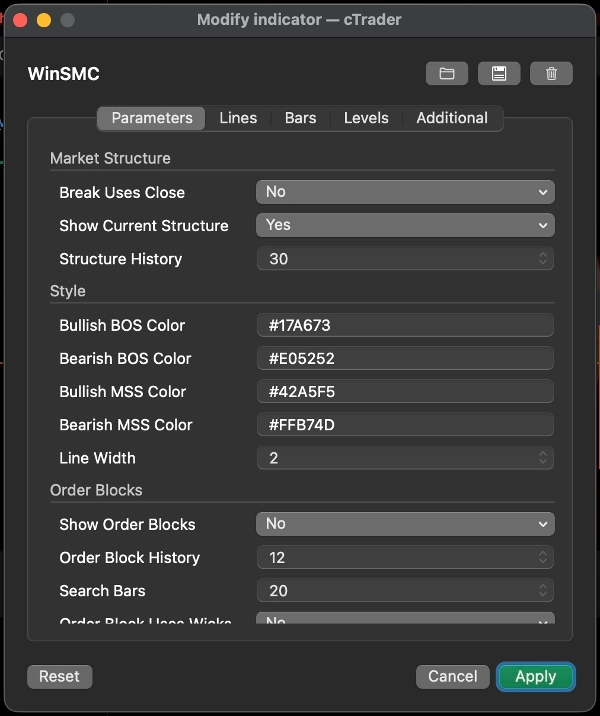
2. Các Khái Niệm Cốt Lõi
Độ Dài Swing
`Swing Length` kiểm soát khoảng cách sang trái và phải mà một điểm pivot phải được xác nhận trước khi được coi là điểm swing hợp lệ.
Hướng dẫn thực tế:
- Giá trị nhỏ hơn = nhiều tín hiệu hơn, nhiều nhiễu hơn
- Giá trị lớn hơn = ít tín hiệu hơn, cấu trúc sạch hơn
Phá Vỡ Sử Dụng Đóng Cửa
Cài đặt này quyết định liệu một sự phá vỡ cấu trúc được xác nhận bằng:
- `Có`: đóng nến
- `Không`: phá vỡ bấc/đáy/đỉnh
Hướng dẫn:
- Dùng đóng cửa để có cách tiếp cận thận trọng hơn
- Dùng phá vỡ bấc để phát hiện sớm hơn, nhạy cảm hơn
Hiển Thị Cấu Trúc Hiện Tại
Hiển thị các đường swing high và swing low đang hoạt động hiện tại, giúp bạn thấy thị trường đang tôn trọng điều gì.
Lịch Sử Cấu Trúc
Kiểm soát số lượng đường và nhãn phá vỡ cấu trúc được giữ trên biểu đồ.
3. BOS và MSS
BOS
`BOS` nghĩa là giá tiếp tục theo cùng một hướng và phá vỡ đỉnh hoặc đáy trước đó.
Diễn giải điển hình:
- Trong xu hướng tăng, phá vỡ đỉnh trước là BOS tăng giá
- Trong xu hướng giảm, phá vỡ đáy trước là BOS giảm giá
MSS
`MSS` nghĩa là thị trường đã thay đổi hướng so với xu hướng trước đó.
Diễn giải điển hình:
- Nếu giá trước đó giảm và phá vỡ đỉnh trước, đó là MSS tăng giá
- Nếu giá trước đó tăng và phá vỡ đáy trước, đó là MSS giảm giá
Sử Dụng Giao Dịch
- `BOS` thiên về tiếp tục xu hướng
- `MSS` thiên về đảo chiều
- Các điểm vào tốt nhất thường đến từ việc retest `Order Block` hoặc `FVG`
4. Order Blocks
`Order Block` là cây nến đối lập cuối cùng trước khi phá vỡ cấu trúc. Nó thường được coi là vùng phản ứng cung/cầu.
Hiển Thị Order Blocks
Khi bật, chỉ báo sẽ nhìn lại sau `BOS` hoặc `MSS` và vẽ vùng cây nến đối lập cuối cùng.
Ý Nghĩa
- OB tăng giá: sau phá vỡ tăng, dùng cây nến giảm cuối cùng
- OB giảm giá: sau phá vỡ giảm, dùng cây nến tăng cuối cùng
Khi giá bắt đầu tương tác với vùng này, nó được đánh dấu là đã được giảm nhẹ.
Order Block Sử Dụng Bấc
Điều này kiểm soát độ rộng của hộp được vẽ:
- `Có`: dùng toàn bộ phạm vi nến, vùng rộng hơn
- `Không`: dùng vùng lõi chặt hơn
Hướng dẫn:
- Dùng `Có` cho vùng rộng hơn, thận trọng hơn
- Dùng `Không` cho vùng hẹp hơn, chính xác hơn
Chiến Lược Order Block
Quy trình phổ biến:
1. Chờ `BOS` hoặc `MSS`
2. Đánh dấu OB tương ứng
3. Chờ retest
4. Tìm xác nhận trước khi vào lệnh
Không coi OB là điểm đảo chiều chắc chắn. Nó là vùng có sự quan tâm cao, không phải là điều chắc chắn.
5. Thu Hút Thanh Khoản / Quét
`Liquidity Grab` nghĩa là giá chạy lên trên đỉnh trước hoặc xuống dưới đáy trước, sau đó đóng cửa trở lại bên trong.
Trong chỉ báo này:
- `Buy-side sweep`: giá lấy đỉnh trước và đóng cửa trở lại dưới nó
- `Sell-side sweep`: giá lấy đáy trước và đóng cửa trở lại trên nó
Điều này thường có nghĩa là thị trường đã thu hút thanh khoản và có thể đang chuẩn bị cho bước đi tiếp theo.
Quan Trọng
Một lần quét đơn lẻ không phải là tín hiệu giao dịch.
Nó được coi tốt hơn như:
- Cảnh báo rằng thanh khoản đã bị lấy đi
- Gợi ý thiết lập
- Lý do để chờ `MSS` hoặc `BOS`
Sử Dụng Phổ Biến
- Sau `Buy-side sweep`, một `MSS` giảm giá có thể hỗ trợ thiết lập lệnh bán
- Sau `Sell-side sweep`, một `MSS` tăng giá có thể hỗ trợ thiết lập lệnh mua
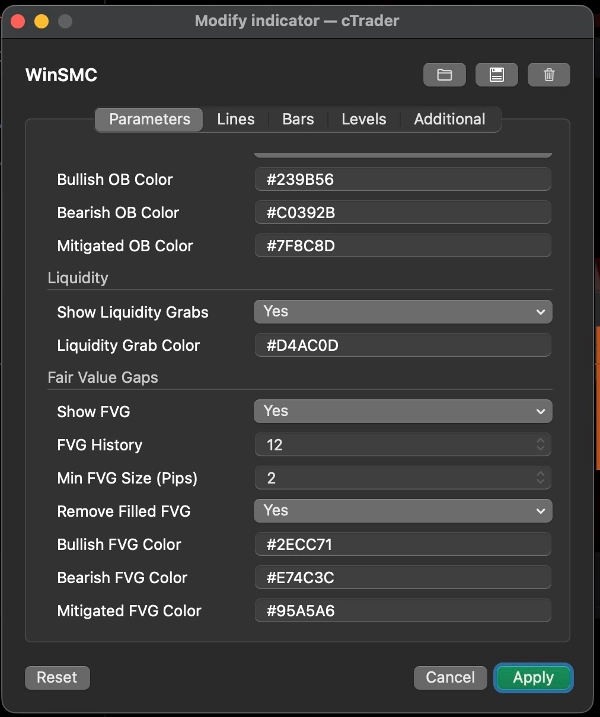
6. FVG
`FVG` là Khoảng Trống Giá Trị Công Bằng được tạo ra bởi sự mất cân bằng của ba cây nến.
Hiển Thị FVG
Khi bật, chỉ báo vẽ các vùng FVG có thể nhìn thấy.
Quy Tắc Phát Hiện
- FVG tăng giá: đỉnh cây nến đầu tiên thấp hơn đáy cây nến thứ ba
- FVG giảm giá: đáy cây nến đầu tiên cao hơn đỉnh cây nến thứ ba
Kích Thước FVG Tối Thiểu (Pips)
Điều này lọc bỏ các khoảng trống nhỏ.
- Đơn vị: `pips`
- Giá trị cao hơn = ít FVG hơn nhưng có ý nghĩa hơn
- `0` = không lọc kích thước
Hữu ích khi biểu đồ bị rối hoặc khi các khoảng trống nhỏ 1-pixel không hữu ích cho quy trình làm việc của bạn.
Loại Bỏ FVG Đã Được Lấp Đầy
Khi bật, các FVG đã được lấp đầy hoàn toàn sẽ bị loại bỏ khỏi biểu đồ.
Chiến Lược FVG
Hai cách tiếp cận phổ biến:
1. Giá hồi theo xu hướng
- Chờ `BOS` hoặc `MSS`
- Chờ giá hồi vào vùng FVG
- Giao dịch theo hướng cấu trúc
2. Vào lệnh dựa trên xác nhận
- Quan sát một lần quét
- Chờ `MSS`
- Dùng FVG làm vùng hồi cuối cùng
7. Phong Cách Giao Dịch Được Khuyến Nghị
Chiến Lược A: Tiếp Tục Xu Hướng
Phù hợp nhất khi thị trường có xu hướng rõ ràng.
Quy trình:
1. Chờ `BOS`
2. Đánh dấu OB
3. Tìm hồi vào OB hoặc FVG
4. Vào lệnh chỉ sau khi giá phản ứng
Đây là cách tiếp cận theo xu hướng cổ điển.
Chiến Lược B: Quét Rồi Đảo Chiều
Phù hợp nhất khi thị trường biến động và dễ bị phá vỡ giả.
Quy trình:
1. Phát hiện `Buy-side sweep` hoặc `Sell-side sweep`
2. Chờ `MSS` ngược lại
3. Dùng OB hoặc FVG làm vùng hồi
4. Vào lệnh sau khi xác nhận
Điều này mạnh hơn so với việc giao dịch chỉ dựa trên lần quét.
Chiến Lược C: Kết Hợp Quét + MSS + OB/FVG
Đây là một trong những cách sử dụng chỉ báo sạch nhất.
Quy trình:
1. Có một lần quét
2. Có một MSS
3. Chờ retest OB hoặc FVG
4. Giao dịch chỉ khi các vùng chồng lên nhau
Điều này giảm các lần vào lệnh sớm.
8. Gợi Ý Cài Đặt Nhanh
- `Swing Length`: bắt đầu với 5 hoặc 7
- `Break Uses Close`: bật để có cái nhìn thận trọng hơn
- `Order Block Uses Wicks`: bật để có vùng rộng hơn
- `Min FVG Size (Pips)`: bắt đầu với 2.0 và điều chỉnh theo công cụ
- `Structure History` / `Order Block History` / `FVG History`: điều chỉnh để giữ biểu đồ dễ đọc
9. Lưu Ý Cuối Cùng
`WinSMC` nên được sử dụng như một bản đồ cấu trúc, không phải là một tín hiệu kích hoạt đơn lẻ.
Quy trình đáng tin cậy nhất là:
- Xác định hướng xu hướng
- Quan sát quét thanh khoản
- Chờ MSS hoặc BOS
- Dùng OB hoặc FVG làm vùng vào lệnh
- Vào lệnh chỉ sau khi có xác nhận
Tóm tắt
The indicator helps traders analyze price action by marking swing highs and lows, confirming valid swing points based on customizable swing length, and distinguishing breaks using candle closes or wick extremes. Order Blocks are displayed as supply/demand zones derived from the last opposite candle before a structure break, with options to adjust zone width. Liquidity Sweeps indicate price movements beyond prior highs or lows that close back inside, signaling potential setups rather than direct trade signals. FVG zones are identified by three-candle imbalances and can be filtered by minimum size and removed once filled.
WinSMC supports multiple trading strategies, including trend continuation after BOS, reversal setups following liquidity sweeps and MSS, and confluence-based entries combining sweeps, MSS, and retests of Order Blocks or FVGs. It is intended as a confirmation and structure mapping tool rather than an automated trading system, aiding traders in timing entries with contextual market information.

![Logo "[CB] Pivot Points Pro"](https://cdn.ctrader.com/image/webp/43463c82-67b0-4f10-a4ba-901bba091d81_32594)


