


Mô tả
BUBBLEXRAY — CHỤP X-QUANG KHỐI LƯỢNG BONG BÓNG TỐI ƯU CHO CTRADER ( PHIÊN BẢN 🇧🇷 BÊN DƯỚI)
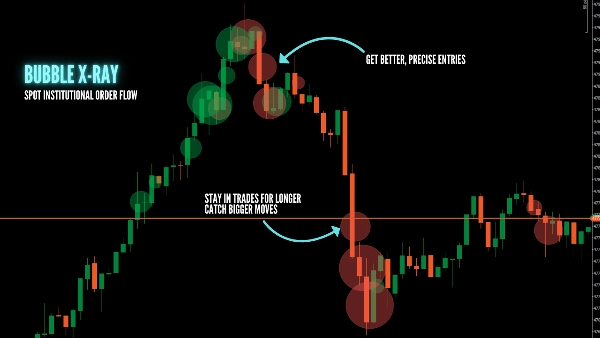
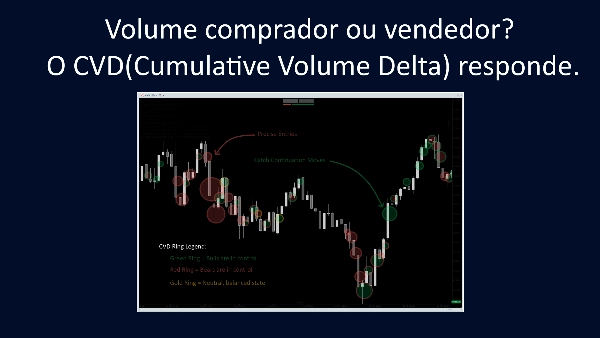
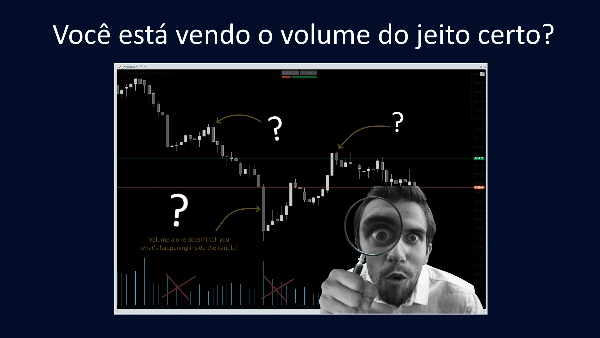
Phát hiện nơi tiền thật di chuyển. BubbleXRay xác định các đỉnh khối lượng cao và hiển thị chúng dưới dạng bong bóng tỷ lệ trực tiếp trên hành động giá của bạn. Hiển thị sự thay đổi delta khối lượng tích lũy (CVD) được tích hợp trong một chỉ báo duy nhất, không làm rối hoặc làm bẩn biểu đồ của bạn. Không còn đoán mò—xem dấu vết tổ chức ngay khi chúng xảy ra.
✅ TẠI SAO SỬ DỤNG BUBBLEXRAY?
- Đỉnh Hoạt Động Ngay Lập Tức: Bong bóng hình thành ngay khi một thanh khối lượng cao đóng lại.
- Dấu Vết Tổ Chức: Bong bóng lớn ở các mức quan trọng tiết lộ nơi các nhà đầu tư lớn hoạt động.
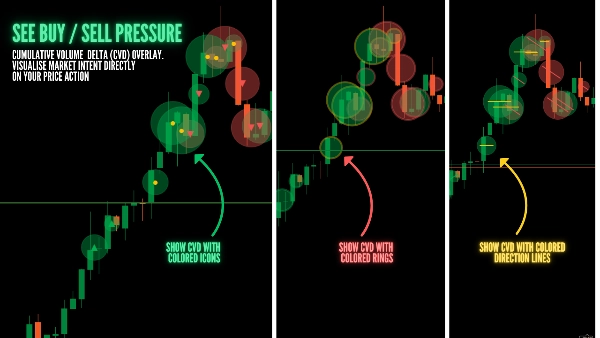
- Thông Minh CVD: Delta Khối Lượng Tích Lũy tích hợp cho thấy áp lực tăng hay giảm.
- Tự Động Điều Chỉnh: Cửa sổ phân vị cuộn thích ứng với bất kỳ điều kiện thị trường nào (Xu hướng hoặc Biên độ).
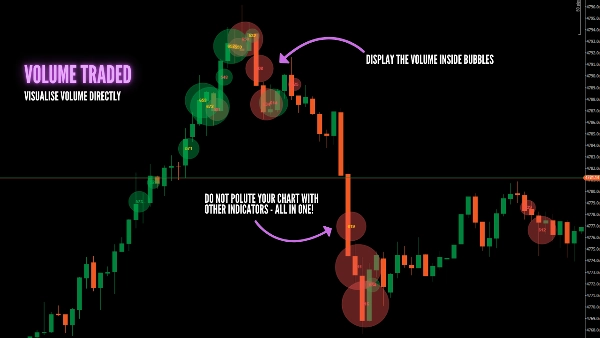
- Gắn Liền Với Giá: Khối lượng được hiển thị tại mức giá chính xác, không bị ẩn trong biểu đồ phụ.
Ví Dụ Cài Đặt Sẵn: Vàng (XAUUSD) - Biểu Đồ 1M
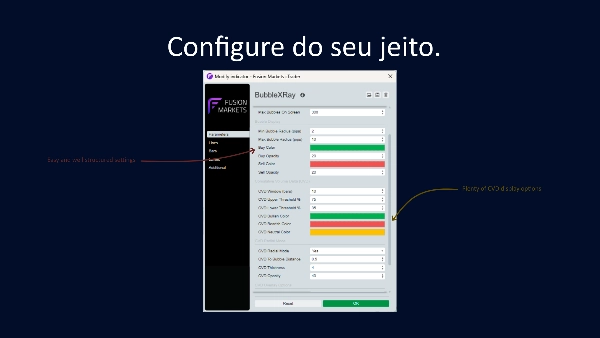
- Ngưỡng Phân Vị Khối Lượng: 50
- Cửa Sổ Phân Vị (thanh): 250
- Số Bong Bóng Tối Đa Trên Màn Hình: 20
- Bán Kính Bong Bóng Tối Thiểu (pip): 5 ➡ (ví dụ cho EUR/USD: 0.1)
- Bán Kính Bong Bóng Tối Đa (pip): 20 ➡ (ví dụ cho EUR/USD: 0.8)
- Chu Kỳ Lăn CVD (thanh): 10
- Độ Dốc Nhìn Lại CVD (thanh): 7
- Hệ Số Phẳng CVD: 1.8
- Chế Độ CVD Hình Tròn: Không
- Khoảng Cách Từ CVD Đến Bong Bóng: 0.5
- Độ Dày CVD: 4
- Độ Mờ CVD: 40
- Tùy Chọn Phủ Lên CVD: Không
- Chế Độ Gỡ Lỗi: Không
📺 XEM HƯỚNG DẪN & THAM GIA CỘNG ĐỒNG:
(Vui lòng đăng câu hỏi/yêu cầu hỗ trợ của bạn trong phần bình luận video để giúp cộng đồng của chúng ta phát triển!)
🛠️ TÍNH NĂNG CHÍNH:
- Kích Thước Tỷ Lệ: Kích thước bong bóng tỷ lệ tuyến tính với độ lớn khối lượng.
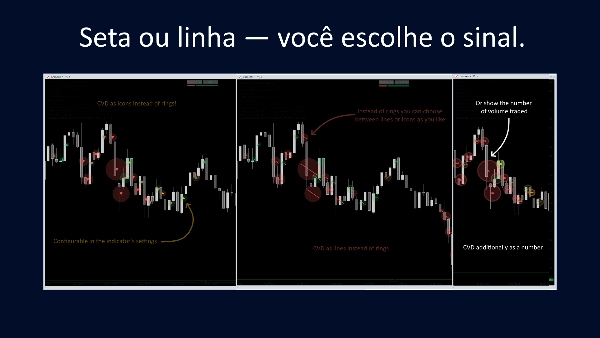
- Xác Nhận Đôi: Kết hợp Vòng Tròn Hình Tròn và Mũi Tên Phủ Lên để có bối cảnh CVD sâu hơn.
- Không Cần Cấu Hình: Tự động chọn khung thời gian dữ liệu tốt nhất cho biểu đồ của bạn.
- Giao Diện Sạch: Độ mờ và giới hạn hiển thị có thể cấu hình để giữ cho biểu đồ của bạn chuyên nghiệp.
🇧🇷 BUBBLEXRAY — CHỤP X-QUANG KHỐI LƯỢNG TỐI ƯU CHO CTRADER
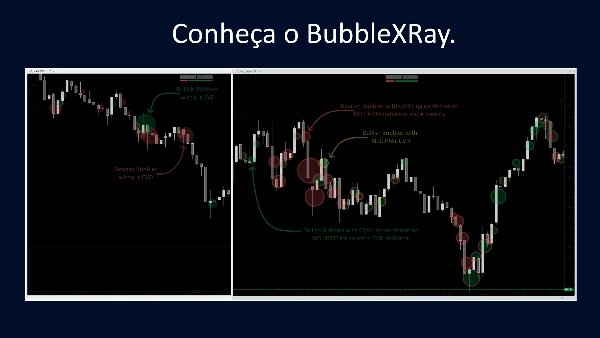
Xác định nơi "Smart Money" đang hoạt động. O BubbleXRay đánh dấu các đỉnh khối lượng cao với bong bóng tỷ lệ trực tiếp trên giá. Hiển thị sự thay đổi tích lũy của khối lượng (CVD) tích hợp trong một chỉ báo duy nhất, không làm quá tải hoặc làm bẩn biểu đồ của bạn. Không còn nghi ngờ: xem dấu vết tổ chức ngay khi nó xảy ra.
✅ TẠI SAO SỬ DỤNG BUBBLEXRAY?
- Đỉnh Hoạt Động Ngay Lập Tức: Bong bóng xuất hiện ngay khi một thanh khối lượng cao đóng lại.
- Dấu Vết Tổ Chức: Bong bóng lớn ở các mức quan trọng tiết lộ nơi các nhà đầu tư lớn hoạt động.
- Thông Minh CVD: Delta Khối Lượng Tích Lũy tích hợp cho thấy áp lực là Mua hay Bán.
- Tự Động Điều Chỉnh: Hệ thống phân vị thích ứng với bất kỳ thị trường nào (Xu hướng hoặc Biên độ).
- Gắn Liền Với Giá: Khối lượng được hiển thị tại mức giá chính xác, không bị ẩn trong biểu đồ phụ.
📺 XEM HƯỚNG DẪN VÀ GIẢI ĐÁP THẮC MẮC:
(Vui lòng đăng câu hỏi và yêu cầu hỗ trợ của bạn trong phần bình luận video ở trên, để chúng tôi có thể giúp đỡ nhiều người nhất có thể!)
🛠️ ĐIỂM NỔI BẬT KỸ THUẬT:
- Kích Thước Tỷ Lệ: Bán kính bong bóng tỷ lệ theo độ lớn của khối lượng.
- Xác Nhận Đôi: Sử dụng Vòng Tròn Hình Tròn và Mũi Tên Phủ Lên để có bối cảnh CVD sâu hơn.
- Không Cần Cấu Hình: Tự động chọn khung thời gian dữ liệu tốt nhất cho biểu đồ của bạn.
- Giao Diện Sạch: Độ mờ và giới hạn hiển thị có thể cấu hình để giữ cho thiết lập của bạn chuyên nghiệp.
Tóm tắt
Đánh giá của khách hàng
5 | 33 % | |
4 | 67 % | |
3 | 0 % | |
2 | 0 % | |
1 | 0 % |
Thảo luận
Câu hỏi thường gặp

























Giá