
Deskripsi
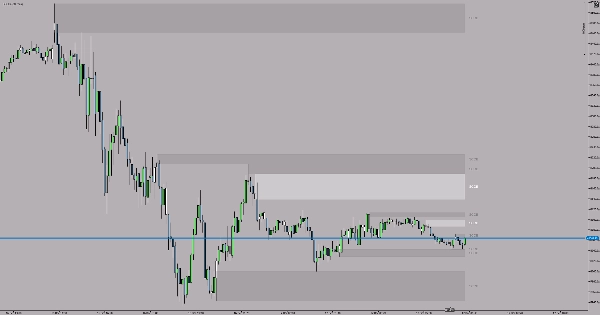
Indikator SCOB (Single Candle Order Block) secara otomatis mengidentifikasi dan menyoroti pola blok pesanan yang kuat pada grafik Anda. Alat sederhana namun efektif ini membantu trader mengenali pola pembalikan kunci yang sering menunjukkan aktivitas institusional yang kuat.
Apa itu SCOB?
SCOB adalah pola tiga lilin yang mengungkapkan zona pembalikan potensial:
Bullish SCOB:
- Lilin ke-2 membuat low yang lebih rendah daripada lilin ke-3
- Low lilin ke-1 tetap di atas low lilin ke-2
- Lilin ke-1 ditutup di atas high lilin ke-2
- Lilin ke-2 disorot sebagai zona support potensial
Bearish SCOB:
- Lilin ke-2 membuat high yang lebih tinggi daripada lilin ke-3
- High lilin ke-1 tetap di bawah high lilin ke-2
- Lilin ke-1 ditutup di bawah low lilin ke-2
- Lilin ke-2 disorot sebagai zona resistance potensial
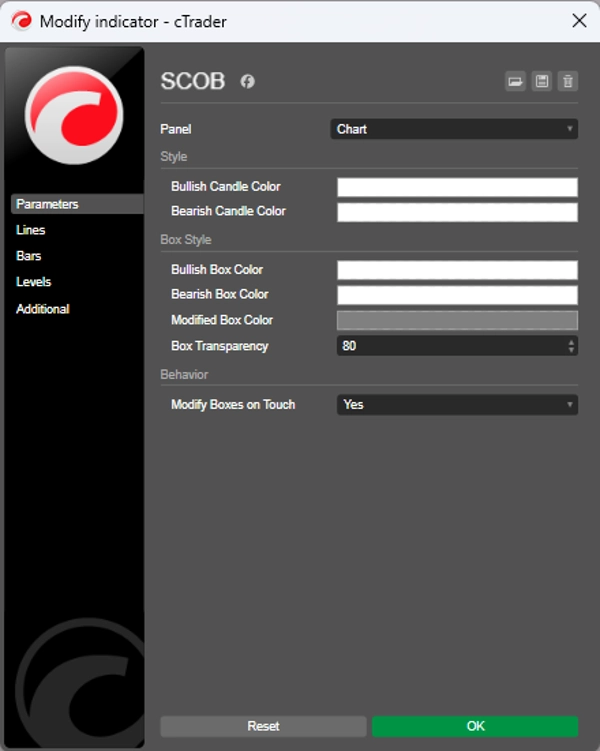
Pengaturan
Warna Lilin Bullish - Pilih warna sorotan untuk pola SCOB bullish (Default: Putih)
Warna Lilin Bearish - Pilih warna sorotan untuk pola SCOB bearish (Default: Kuning)
Tips Penggunaan
- Gunakan pola SCOB untuk mengidentifikasi zona masuk potensial
- Gabungkan dengan alat analisis teknikal lain untuk konfirmasi
- Lilin yang disorot mewakili level institusional kunci
- Selalu trading mengikuti tren untuk setup dengan probabilitas lebih tinggi
- Dapat digunakan pada timeframe apa pun berdasarkan strategi trading Anda
- Praktik terbaik: Tandai pola SCOB pada timeframe yang lebih tinggi (H1, H4, Daily) dan tradinglah sesuai arah tren.
Ringkasan
Profil indikator
Ulasan pelanggan
4.5
Ulasan: 2
5 | 50 % | |
4 | 50 % | |
3 | 0 % | |
2 | 0 % | |
1 | 0 % |
Ulasan pelanggan
October 3, 2025
Helps more when the trader avoids forced trades. It should not replace the chart.
Diskusi
Pertanyaan umum
BTCUSD
Forex
Indices
EURUSD
Commodities
GBPUSD
Prop
Scalping
SMC
Crypto
Stocks
XAUUSD
NAS100
USDJPY
Produk-produk yang tersedia melalui cTrader Store, termasuk bot trading, indikator, dan plugin, disediakan oleh pengembang pihak ketiga serta hanya ditujukan untuk akses teknis dan informasi. cTrader Store bukan broker dan tidak menyediakan saran investasi, rekomendasi pribadi, atau jaminan apa pun tentang kinerja di masa mendatang.


Harga
Sejak 05/01/2025
14
Penjualan