


Deskripsi
#### Fitur
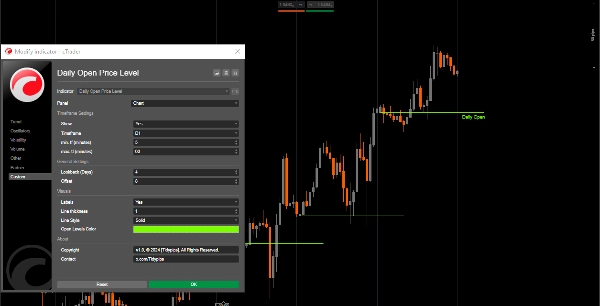
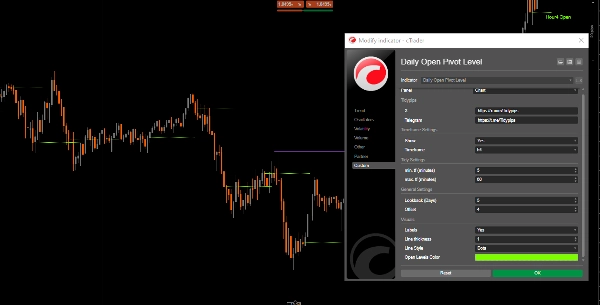
- **Kerangka Waktu yang Dapat Disesuaikan**: Pengguna dapat memilih kerangka waktu tertentu (misalnya, harian) untuk menganalisis level pembukaan. Jangan atur TF apa pun < 1H.
- **Periode Lookback**: Indikator mendukung periode lookback, memungkinkan trader untuk fokus pada aksi harga terbaru dan mengidentifikasi titik-titik penting yang relevan.
- **Garis Tren Dinamis**: Ini menggambar garis tren untuk menunjukkan harga pembukaan dari kerangka waktu yang dipilih, memberikan petunjuk visual yang jelas untuk level support dan resistance potensial.
- **Opsi Pelabelan**: Trader dapat mengaktifkan label untuk menampilkan harga pembukaan langsung di grafik, meningkatkan kejelasan dan pemahaman.
- **Kustomisasi Visual**: Pengguna dapat menyesuaikan warna garis, gaya, dan ketebalan sesuai preferensi mereka dan meningkatkan keterbacaan grafik.
- **Pembatasan Kerangka Waktu**: Indikator menyertakan pemeriksaan untuk memastikan hanya beroperasi dalam pengaturan kerangka waktu minimum dan maksimum yang ditentukan, mencegah sinyal yang menyesatkan.
#### Tutorial
1. **Pengaturan**: Buka pengaturan indikator untuk memilih kerangka waktu yang diinginkan, periode lookback, dan sesuaikan parameter visual seperti warna garis dan ketebalan.
2. **Menggunakan Indikator**: Setelah diterapkan, indikator akan secara otomatis menggambar level harga pembukaan pada grafik Anda berdasarkan pengaturan yang ditentukan.
3. **Analisis**: Amati level yang digambar saat Anda berdagang. Gunakan level ini untuk mengidentifikasi zona support dan resistance potensial, serta membuat keputusan trading yang tepat.
#### Alat Pendamping yang Direkomendasikan
- **cTrader**: Platform asli untuk cAlgo, menyediakan pengalaman yang mulus untuk menggunakan dan menyesuaikan indikator.
- **Alat Analisis Teknikal**: Gabungkan indikator ini dengan alat lain seperti moving averages atau oscillator untuk meningkatkan strategi trading dan analisis pasar Anda.
- **Alat Manajemen Risiko**: Gunakan kalkulator ukuran posisi dan alat stop-loss untuk mengelola risiko secara efektif saat berdagang di sekitar level pembukaan yang diidentifikasi.
Dengan mengintegrasikan Daily Open Pivot Level Indicator dengan alat-alat ini, trader dapat meningkatkan analisis pasar mereka dan memperbaiki peluang keberhasilan dalam menavigasi kompleksitas trading intraday.
Ringkasan
Ulasan pelanggan
5 | 100 % | |
4 | 0 % | |
3 | 0 % | |
2 | 0 % | |
1 | 0 % |


![Logo "[Stellar Strategies] Inside Bar with Signals"](https://cdn.ctrader.com/image/webp/1d9e8bfa-3b2c-4440-bb37-5856902008a7_30683)


