
Drawing Utility
Индикатор
208 скачивания
Версия 1.0, Jul 2025
Windows, Mac
Описание
Alt + Перетащите, чтобы активировать на ваших графиках.
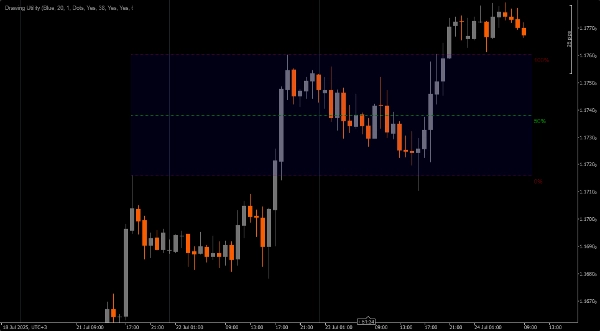
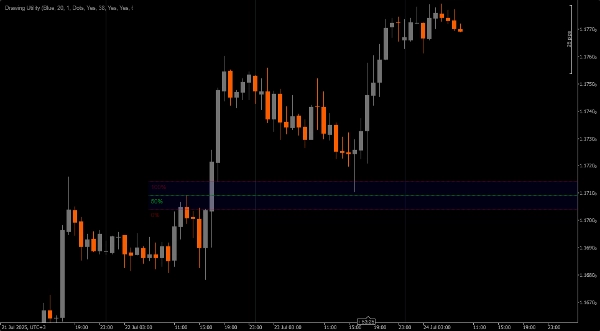
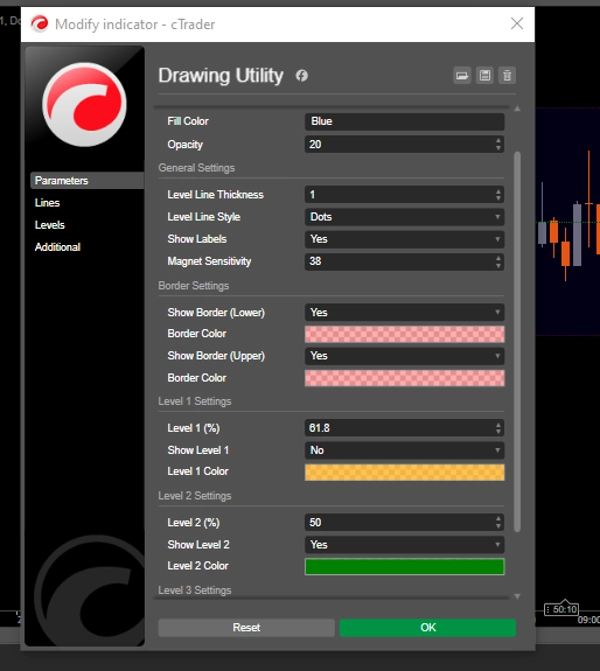
Настраиваемый инструмент для рисования.
1. Быстрый доступ к Фибоначчи.
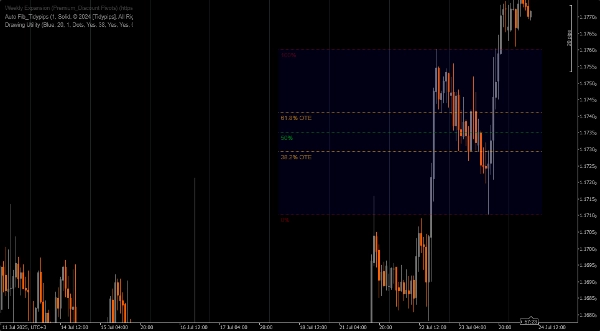
2. Маркер Fair Value Gap
3. Измерительный инструмент
4. Маркер точки интереса
5. или любое другое использование (о котором я не подумал), которое вы сочтете подходящим для аннотирования ваших графиков
ПРИМЕЧАНИЕ **Alt + Перетащите, чтобы активировать на ваших графиках.**
Сводка
ИИ-сводка
Drawing Utility is a customizable chart annotation tool designed for trading platforms. It features a rectangular box with five adjustable Fibonacci levels, which can also be customized to user-defined values. The utility is activated by pressing Alt and dragging on the chart. Key functionalities include quick access to Fibonacci retracement levels, marking Fair Value Gaps, measuring price movements, and highlighting Points of Interest. Additionally, it supports flexible use cases for various chart annotations, allowing traders to tailor it to their specific analysis needs.
Профиль индикатора
Отзывы покупателей
0.0
Отзывы: 0
Отзывы покупателей
У этого продукта еще нет отзывов. Уже попробовали его? Поделитесь впечатлениями!
Обсуждение
Частые вопросы
Продукты, доступные в cTrader Store, включая торговых ботов, индикаторы и плагины, предоставляются сторонними разработчиками и доступны исключительно в информационных и технических целях. cTrader Store не является брокером и не предоставляет инвестиционные консультации, персональные рекомендации или какие-либо гарантии будущей доходности.
Больше от этого автора


Цена
15
Продажи
4.61K
Бесплатные установки