
Deskripsi
QX SmartStructure (QX SS)
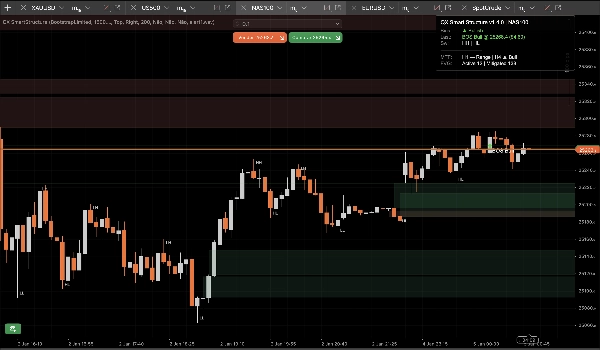
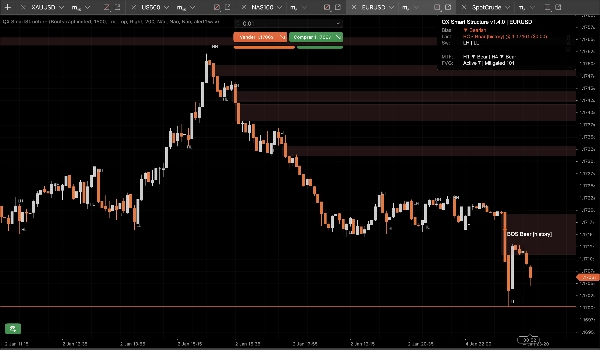
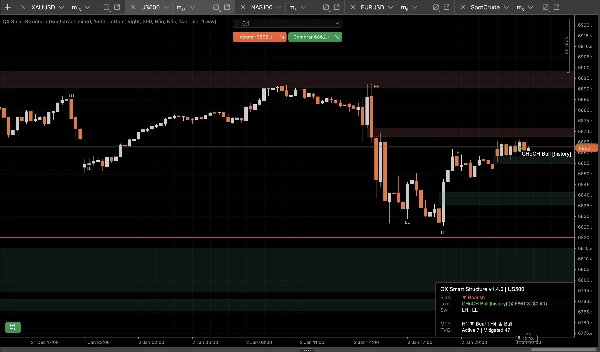
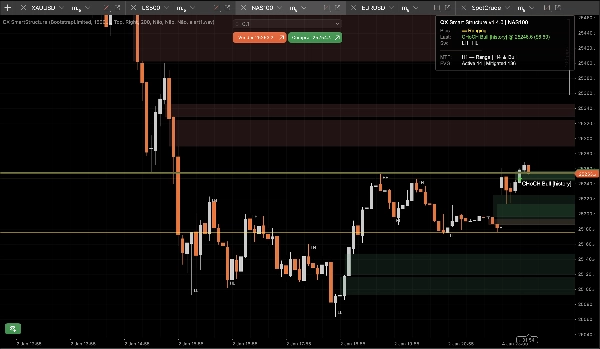
QX SmartStructure (QX SS) adalah overlay SMC ringan dengan tepi kanan keras untuk cTrader. Ini menunjukkan struktur saat ini, BOS/CHoCH breaks, zona FVG yang difilter + dikelola otomatis, dan panel bias MTF H1/H4 yang ringkas sehingga Anda berhenti bolak-balik antar timeframe.
Alat visualisasi saja. Ini tidak melakukan perdagangan.
Apa yang Ditampilkan
1) Struktur Pasar Bersih (Tepi Kanan Keras)
- Label ayunan: HH / HL / LH / LL
- Level kunci: ayunan tinggi terakhir yang dikonfirmasi dan ayunan rendah terakhir yang dikonfirmasi
- Peristiwa break: BOS / CHoCH dengan kekuatan (Kuat vs Lemah)
- Mode tampilan:
-
- ActiveOnly (minimal)
- RecentSwings (konteks terkontrol)
2) Zona FVG yang tetap terkendali
- FVG bullish dan bearish persegi panjang FVG
- Ukuran Min FVG (langkah) filter menghapus celah mikro secara otomatis
- Aturan mitigasi 50% (berbasis sumbu): zona menjadi termitigasi saat harga mencapai level setengahnya
- Siklus hidup:
-
- Auto-Hide Mitigated = ON untuk grafik paling bersih
- OFF menjaga zona termitigasi sebagai konteks “hantu” (opasitas lebih rendah)
- Batas keras mencegah spam objek selama sesi panjang (disimpan/digambar/diperpanjang ke kanan)
3) Panel Bias MTF (H1 / H4)
Panel ringkas menampilkan:
- Bias timeframe saat ini: Bullish / Bearish / Ranging / Tidak Diketahui
- Peristiwa terakhir: BOS/CHoCH, arah, kekuatan
- Snapshot opsional: Bias H1 dan Bias H4
4) Peringatan suara opsional
Peringatan hanya suara untuk break, dengan:
- Opsional peringatan pada break lemah
- Nama file suara kustom
Keunggulan StepSize (FX, Emas, Indeks)
Sebagian besar alat struktur rusak saat Anda mengganti simbol karena mereka menganggap “pips” berarti sama di mana-mana.
QX SS menggunakan StepSize sebagai satuan universal: TickSize → PipSize → Digits fallback
Konversi jarak apa pun ke langkah
langkah = jarak_harga ÷ TickSize
Contoh (ukuran tick umum):
- EURUSD TickSize 0.00001: 1 pip (0.00010) = 10 langkah
- XAUUSD TickSize 0.01: $0.10 = 10 langkah, $1.00 = 100 langkah
- Indeks bervariasi menurut broker:
Di mana menemukan TickSize
- Di cTrader Automate: Symbol.TickSize (QX SS membacanya dengan aman)
- Di UI platform: panel spesifikasi simbol (info simbol Market Watch)
Ukuran Min FVG yang Direkomendasikan (langkah)
Ini adalah rentang awal praktis, bukan kebenaran universal. Volatilitas dan sesi penting.
M15 (alur kerja default)
- EURUSD: 20–40 langkah (≈ 2–4 pips jika TickSize = 0.00001)
- XAUUSD: 30–120 langkah (≈ $0.30–$1.20 jika TickSize = 0.01)
- US500 / NAS100: pilih pergerakan bermakna dalam poin, lalu konversi:
M5 (ya, ini berubah)
M5 mencetak lebih banyak celah mikro. Jika Anda mempertahankan MinFVGSteps yang sama, Anda akan menyaring terlalu banyak.
Penyesuaian tipikal: kurangi MinFVGSteps sekitar 30–50% dibandingkan nilai M15 Anda, lalu sesuaikan ulang.
“Ranging” bukan bug!
Bias menjadi Ranging ketika ayunan tinggi/rendah terbaru tidak sejajar dengan jelas sebagai HH+HL atau LH+LL.
Dalam kondisi chop, alat yang tetap “Bullish” selamanya berbohong. QX SS bersifat konservatif secara desain.
Preset (titik awal)
Preset A: “M15 Seimbang” (default yang direkomendasikan)
- Kekuatan Ayunan (M15=7): 7
- Tipe Break: Close
- Hanya yang Dikonfirmasi: true
- Mode Tampilan: RecentSwings
- Jumlah Ayunan Terbaru: 30
- Ukuran Min FVG (langkah): EURUSD 25 | XAUUSD 60 | Indeks 15 (lalu sesuaikan)
- Auto-Hide Mitigated: true
- Max FVG Digambar: 30
- Perpanjang Bar ke Kanan: 50
- Tampilkan MTF H1: true
- Tampilkan MTF H4: true
Preset B: “Grafik Bersih M15”
- Mode Tampilan: ActiveOnly
- Tampilkan Label Ayunan: false
- Auto-Hide Mitigated: true
- Max FVG Digambar: 15–20
- (Pertahankan sisanya dari Preset A)
Preset C: “Konteks Scalping M5”
- Kekuatan Ayunan: 5–6
- Tipe Break: Keduanya
- Hanya yang Dikonfirmasi: true (mulai ketat)
- Tampilkan Break Lemah: false
- Ukuran Min FVG (langkah): ~50–70% dari nilai M15 Anda
- Jumlah Ayunan Terbaru: 20–30
- Perpanjang Bar ke Kanan: 30–50
Integrasi cBot / otomatisasi (apa yang diekspos QX SS)
QX SmartStructure mengekspos 3 seri internal untuk cBots:
- BiasSeries: 1 bullish, -1 bearish, 0 selainnya
- BreakSignalSeries: 1 break bull, -1 break bear, 0 selainnya
- BreakLevelSeries: level harga pada bar peristiwa, NaN selainnya (penanda bersih)
Stabilitas dan performa (v1.5.1+)
Dirancang untuk setup multi-grafik dan sesi panjang:
- Memproses hanya pada bar tertutup baru
- Pembaruan UI dibatasi oleh UI Throttle (ms) untuk menjaga CPU tetap rendah
- Jumlah objek terkontrol dan batas pemangkasan mencegah spam grafik
- Mendeteksi “reload keras” yang sebenarnya dengan aman (reload timeframe/simbol/riwayat) dan membangun ulang status tanpa drift
Opsi keamanan baru (v1.5.1+)
Invalidasi Saat Lompatan Gap (default ON)
Jika harga melompat dan melewati zona FVG tanpa menyentuhnya (buka akhir pekan/berita), zona tersebut ditandai Invalidated by Gap alih-alih tetap aktif.
Ini mencegah zona usang tetap ada di grafik setelah pembukaan yang keras.
Pembersihan Seri Penuh Saat Membangun Ulang (default OFF)
Saat membangun ulang keras, secara opsional membersihkan seluruh riwayat seri output yang diekspos untuk konsistensi backtest/ekspor maksimum.
Pertahankan OFF untuk performa terbaik pada riwayat besar. Nyalakan ON hanya untuk alur kerja backtesting mendalam yang membutuhkan integritas historis penuh.
Default yang direkomendasikan
- Invalidasi Saat Lompatan Gap: Ya (ON)
- Pembersihan Seri Penuh Saat Membangun Ulang: Tidak (OFF)
Penafian
Alat ini hanya untuk visualisasi dan dukungan pengambilan keputusan. Perdagangan berisiko. Selalu gunakan manajemen risiko Anda sendiri.
Ringkasan
It automatically detects and manages Fair Value Gap (FVG) zones, filtering out micro-gaps based on a configurable minimum size measured in steps, a universal unit derived from the symbol’s TickSize. The indicator applies a 50% mitigation rule to mark zones as mitigated when price reaches their midpoint, with options to auto-hide or display mitigated zones as ghosted.
QX SmartStructure includes a compact multi-timeframe (MTF) bias panel showing current timeframe bias (Bullish, Bearish, Ranging, or Unknown) and recent break events for H1 and H4 timeframes. Optional sound alerts notify users of break events, including weak breaks.
The tool supports various markets such as Forex, commodities (e.g., gold), indices, and cryptocurrencies by adapting to symbol-specific TickSize values. It exposes internal data series for integration with cBots and is optimized for performance with controlled object counts and throttled updates. The indicator does not place trades and is intended for decision support only.
Ulasan pelanggan
5 | 100 % | |
4 | 0 % | |
3 | 0 % | |
2 | 0 % | |
1 | 0 % |


