
Описание
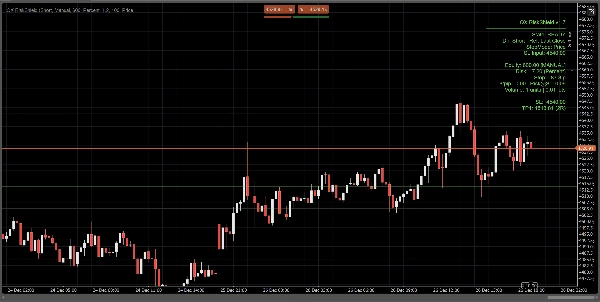
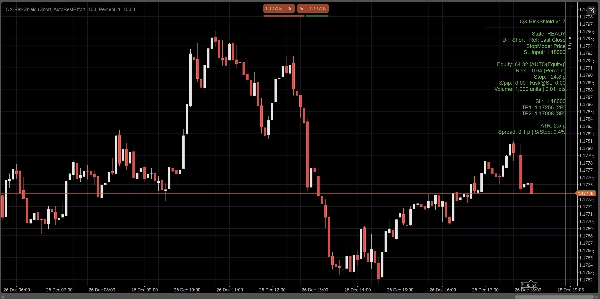
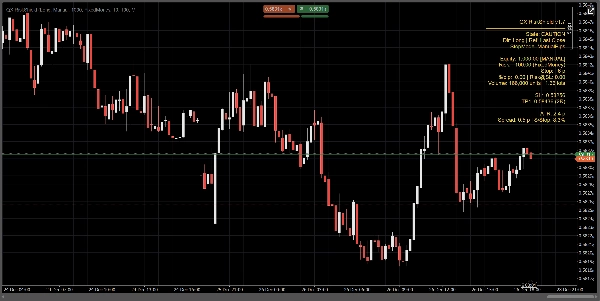
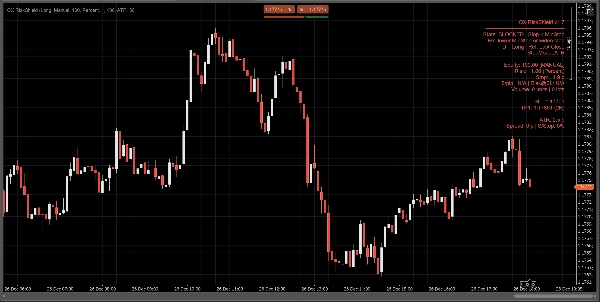
QX RiskShield — это калькулятор риска прямо на графике, который преобразует ваше расстояние стопа в точный размер позиции (единицы и лоты), а также ценовые уровни SL/TP на основе ваших целей R:R. Он разработан для быстрого принятия решений с минимальным загромождением графика.
Это только индикатор. Он не размещает ордера.
Что вы видите:
Компактная панель показывает одним взглядом:
- Состояние: ГОТОВ / ВНИМАНИЕ / ЗАБЛОКИРОВАН
- Источник капитала: Ручной или Авто (максимальные усилия, безопасный резерв)
- Сумма риска: % капитала или фиксированный денежный риск
- Расстояние стопа: в пипсах
- Размер позиции: единицы + лоты (нормализовано под ограничения брокера)
- $/пип и Риск@SL (оценочный риск на стопе)
- SL / TP1 / TP2 ценовые уровни (на основе ваших целей RR)
- Опционально линии входа / SL / TP на графике для визуального ориентирования
Все расчёты основаны на последнем закрытии (стабильно, без мерцания внутри бара).
Режимы стопа:
Выберите, как определяется ваш стоп:
1) Ручные пипсы
Установите фиксированное расстояние стопа в пипсах.
2) ATR стоп
Расстояние стопа = ATR(пипсы) × коэффициент ATR.
Полезно для адаптивного размера позиции в зависимости от волатильности по разным инструментам.
3) Ценовой стоп
Установите точную цену SL (лучше всего для дискреционной торговли).
RiskShield преобразует это ценовое расстояние в пипсы и соответственно рассчитывает размер позиции.
Логика состояний (без путаницы):
RiskShield использует чёткие состояния, чтобы пользователи сразу понимали, что происходит:
ГОТОВ
Вводы корректны. Размер позиции доступен.
ВНИМАНИЕ
Размер позиции корректен, но RiskShield обнаружил слишком узкий стоп по сравнению с ATR.
Это предупреждение, а не блокировка.
ЗАБЛОКИРОВАН
Размер позиции намеренно отключён, когда правила небезопасны или некорректны, например:
- Стоп ниже минимального порога стопа
- Цена SL с неправильной стороны от эталонной цены
- Спрэд слишком высок относительно стопа (процент спрэда к стопу)
- Объём ниже минимального у брокера
- Данные по пипсу/лоту инструмента недоступны
Краткая подсказка «Исправить» может отображаться (опционально) для быстрого исправления вводов.
Как трейдеры используют QX RiskShield (простой рабочий процесс)
- Прикрепите QX RiskShield к вашему графику.
- Выберите направление сделки (лонг или шорт).
- Выберите ваш тип риска:
-
- Процент от капитала, или
- фиксированный денежный риск на сделку
- Выберите режим стопа:
-
- Ручные пипсы, ATR или цена SL
- Прочитайте результат:
-
- Используйте единицы/лоты для размера вашего ордера
- Используйте уровни SL/TP как эталонные цены
- Если панель показывает ВНИМАНИЕ, рассмотрите возможность расширения стопа или использования режима ATR.
- Если панель показывает ЗАБЛОКИРОВАН, отрегулируйте вводы до состояния ГОТОВ.
Опции интерфейса (созданы для чистых графиков):
- Режим панели: Простой или Профессиональный
- Плотность панели: Обычная или Компактная (для минимального текста)
- Показать предложенное исправление: Вкл/Выкл
- Показать линии: Вкл/Выкл
- Показать линию входа: Вкл/Выкл
- Управление выравниванием панели и ограничение обновлений для производительности
Производительность и стабильность:
- Использует последнее закрытие для расчётов. Без перерисовки.
- Ограничение обновлений для снижения нагрузки на процессор в загруженных рабочих пространствах.
- Защитная обработка данных инструмента, ограничений брокера и отсутствующих полей аккаунта.
Важные заметки:
- QX RiskShield — это инструмент поддержки принятия решений, а не финансовая консультация.
- Результаты зависят от спецификаций символов вашего брокера (значение пипса, размер лота, минимальный объём и т.д.).
- Автоматический капитал — это максимальные усилия. Если платформа ограничивает доступ, RiskShield безопасно переключается на ручной капитал.
Идеально подходит для:
- Трейдеров по основным валютным парам и индексам
- Правил риска в стиле проп-фирм
- Скальперов и дейтрейдеров, которым нужен быстрый расчёт размера с жёсткими проверками безопасности
- Трейдеров, предпочитающих ценовой SL, но при этом желающих автоматический расчёт размера
Торгуйте с контролем. Размер позиции с точностью.
Сводка
Отзывы покупателей
5 | 0 % | |
4 | 100 % | |
3 | 0 % | |
2 | 0 % | |
1 | 0 % |


![Логотип продукта "Gaussian Channel [Iridio Capital]"](https://cdn.ctrader.com/image/webp/7c039209-5573-4a54-a072-f9528b503103_41960)


![Логотип продукта "[Stellar Strategies] MARSI Signal Plotter"](https://cdn.ctrader.com/image/webp/7b2b8da6-8f8e-4646-8d4a-4710c516c01e_25567)


![Логотип продукта "High-Low Divergence [Iridio Capital]"](https://cdn.ctrader.com/image/webp/443c4661-7abb-40f1-842f-4b6ec560649b_40914)