
Описание
Продвинутая динамика тренда с осциллятором полос Боллинджера
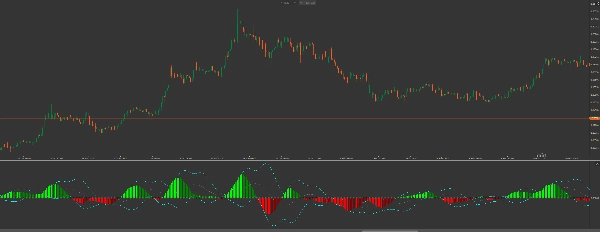
Набор Squeeze Pro: Momentum & Volatility Suite — это инструмент институционального уровня для cTrader. В отличие от стандартных индикаторов, этот набор обеспечивает двухслойный анализ поведения рынка: он выявляет фазу сжатия (сжатие рынка) и отслеживает экстремумы импульса с помощью полос Боллинджера, рассчитанных непосредственно на самом осцилляторе.
Ключевые инновации
-
- Полосы Боллинджера для импульса: Первые в своём роде. Применяя полосы Боллинджера к гистограмме импульса, вы можете определить уровни «перекупленности» или «перепроданности» импульса — идеально для точного выхода до истощения тренда.
- Обнаружение сжатия в трёх состояниях:
-
- Чёрные точки (Сжатие включено): Высокое сжатие. Рынок «наматывается» для мощного прорыва.
- Серые точки (Сжатие выключено): Волатильность расширяется. Движение началось.
- Синие точки (Нет сжатия): Нормальные рыночные условия.
- Сглаживание линейной регрессией: Использует усовершенствованный
CalculateLinearRegressionалгоритм для фильтрации шума цены, обеспечивая плавную и надёжную гистограмму. - Логика двойного наложения: Работает в отдельном окне индикатора, чтобы сохранить чистоту графика цены и при этом предоставлять глубокий аналитический обзор.
Руководство по визуальному восприятию:
-
- Гистограмма (тренд и сила)
-
- Лайм: Бычий импульс ускоряется (сильные покупки).
- Зелёный: Бычий импульс замедляется (фиксация прибыли).
- Красный: Медвежий импульс ускоряется (сильные продажи).
- Бордовый: Медвежий импульс замедляется (продавцы истощены).
- Полосы осциллятора («циановые» линии)
-
- Когда бары гистограммы выходят за пределы циановых полос Боллинджера, текущий тренд находится на статистическом экстремуме. Ожидайте разворотов или крупных откатов, когда гистограмма начинает возвращаться внутрь этих полос.
Торговая стратегия: «Мощный прорыв»
-
- Определите сжатие: Дождитесь появления чёрных точек на нулевой линии. Это указывает на «затишье перед бурей».
- Подтвердите направление: Ищите первый бар гистограммы лайм (покупка) или красный (продажа).
- Триггер: Входите в сделку, когда появляется сжатие выключено (серая точка), сигнализируя о высвобождении энергии.
- Выход: Фиксируйте прибыль, когда гистограмма меняется с лайм на зелёный ИЛИ когда гистограмма достигает верхней полосы осциллятора Боллинджера, сигнализируя об истощении.
Почему стоит перейти на Squeeze Pro?
В то время как базовые индикаторы показывают вам куда пошла цена, Squeeze Pro показывает вам давление, стоящее за движением. Видя одновременно сжатие и полосы импульса, вы избегаете входа в уже исчерпанные тренды и ловите взрывные движения, которые другие пропускают.
Примечание разработчика: Этот индикатор высоко оптимизирован для API cTrader, обеспечивая отсутствие задержек в производительности даже на менее мощных устройствах при обработке сложных вычислений линейной регрессии в реальном времени.
Сводка
Key features include linear regression smoothing to reduce price noise, a dual-overlay display that keeps the price chart uncluttered, and a color-coded histogram that visually represents bullish and bearish momentum strength and changes. When histogram bars move outside the oscillator’s Bollinger Bands (cyan lines), it signals statistically extreme momentum levels, useful for timing entries and exits.
The indicator supports a "Power Breakout" trading strategy: traders wait for squeeze signals, confirm momentum direction via histogram colors, enter trades on squeeze release, and exit when momentum shows signs of exhaustion. This suite provides institutional-grade insights into trend pressure and momentum dynamics, helping traders identify potential explosive moves and avoid exhausted trends.
Отзывы покупателей
5 | 0 % | |
4 | 100 % | |
3 | 0 % | |
2 | 0 % | |
1 | 0 % |


![Логотип продукта "[Hamster-Coder] Bollinger Bands"](https://cdn.ctrader.com/image/webp/21d8e5d6-fb11-4bac-b9ee-cd05c2b76804_30327)


