

Описание
ФИКСИРОВАННЫЙ ОБЪЕМНЫЙ ПРОФИЛЬ ДИАПАЗОНА (FRVP)
Индикатор автоматического определения объемного профиля
--------------------------------------------------
Распределение объема. Зоны стоимости. Узлы с высоким объемом. Всё из вашей трендовой линии.
--------------------------------------------------
ЧТО ДЕЛАЕТ ЭТОТ ИНДИКАТОР
Фиксированный объемный профиль диапазона (FRVP) отображает распределение объема по диапазону, заданному пользователем — автоматически определяя последнюю проведённую вами трендовую линию на графике.
Не требуется ручной выбор диапазона. Просто нарисуйте трендовую линию, и профиль появится.
--------------------------------------------------
КЛЮЧЕВЫЕ ОСОБЕННОСТИ
- АВТОМАТИЧЕСКОЕ ОПРЕДЕЛЕНИЕ последней трендовой линии (не требуется ручное именование)
- Точка контроля (POC) - уровень с наибольшим объемом
- Зона стоимости (VAH + VAL) - настраиваемый процент (по умолчанию 70%)
- Узлы с высоким объемом (HVN) - объем выше среднего порога
- Отображение гистограммы (слева или справа от диапазона)
- Настраиваемое количество строк (от 10 до 200)
- Настраиваемые цвета и прозрачность
- Продление линий вправо
- Показать/скрыть ценовые метки
- Без перерисовки
--------------------------------------------------
КАК ЭТО РАБОТАЕТ
1. Нарисуйте трендовую линию на графике
2. Индикатор автоматически её определяет
3. Объемный профиль рассчитывается по диапазону
4. Отображаются POC, VAH, VAL и HVN
Не требуется именование. Не нужно вручную выбирать диапазон.
--------------------------------------------------
ВИЗУАЛЬНЫЕ ЭЛЕМЕНТЫ
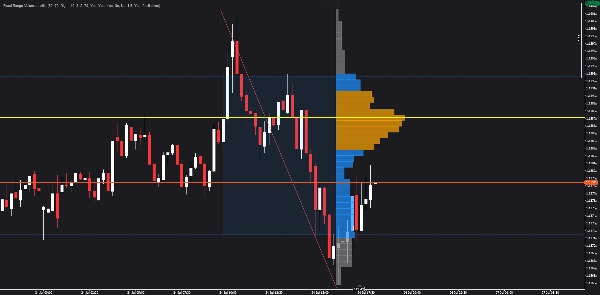
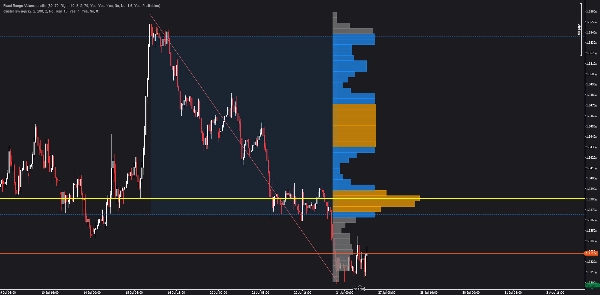
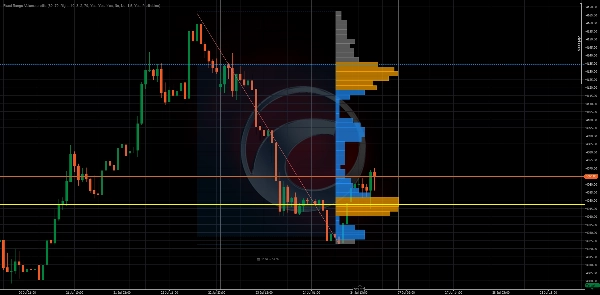
- Жёлтая горизонтальная линия = Точка контроля (POC)
- Синие пунктирные линии = Верхняя (VAH) и нижняя (VAL) зоны стоимости
- Оранжевые бары = Узлы с высоким объемом (HVN)
- Серые бары = Узлы с низким объемом
- Заштрихованная область = Зона стоимости (70% объема)
- Гистограмма = Распределение объема по ценовым уровням
--------------------------------------------------
ОБЗОР ПАРАМЕТРОВ
НАСТРОЙКИ ПРОФИЛЯ:
- Количество строк: сколько ценовых строк (10-200)
- Процент зоны стоимости: % объема в зоне стоимости (1-100)
ВИЗУАЛЬНЫЕ НАСТРОЙКИ:
- Сторона профиля: слева или справа от диапазона
- Ширина гистограммы %: ширина столбцов гистограммы
- Масштабирование ширины столбцов: коэффициент масштабирования ширины
- Мин. ширина столбца %: минимальная ширина столбца
- Прозрачность столбцов: прозрачность (10-100)
ЦВЕТА:
- Цвет POC
- Цвет зоны стоимости
- Цвет узлов с высоким объемом
- Цвет узлов с низким объемом
УЗЛЫ С ВЫСОКИМ ОБЪЕМОМ:
- Порог HVN: множитель объема для квалификации как HVN
НАСТРОЙКИ ТРЕНДОВОЙ ЛИНИИ:
- Автоопределение последней: автоматический поиск последней трендовой линии
- Ручное имя трендовой линии: указать имя (если автоопределение отключено)
--------------------------------------------------
СЛУЧАИ ИСПОЛЬЗОВАНИЯ
- Определить, где был наибольший объем
- Найти точку контроля (POC) для входов/выходов
- Использовать зону стоимости (VAH/VAL) для целей прибыли
- Обнаружить узлы с высоким объемом (HVN) для ключевых уровней
- Быстро понять распределение объема
- Сочетать с другими индикаторами для подтверждения
--------------------------------------------------
ПЕРЕХОД НА STRUCTURAL HEAT ZONES
Этот индикатор показывает распределение объема.
Structural Heat Zones идут дальше — они отображают интенсивность участия, принятие и отторжение, а также вовлечённость рынка в нескольких зонах.
Ищите Structural Heat Zones в магазине cTrader.
--------------------------------------------------
ПЕРЕХОД НА INVICTUS EA
Invictus EA использует структурные технологии для выполнения автоматических сделок.
Ищите Invictus в магазине cTrader.
--------------------------------------------------
ТЕХНИЧЕСКИЕ ЗАМЕТКИ
- Индикатор накладывается поверх графика
- Работает на любом таймфрейме и инструменте
- Без перерисовки (исторический расчет)
- Оптимизирован для производительности
--------------------------------------------------
ПОДДЕРЖКА
Включены пожизненные обновления.
ДЛЯ ПОЛУЧЕНИЯ ДОПОЛНИТЕЛЬНОЙ ИНФОРМАЦИИ - Нажмите на профиль разработчика ниже.





























