
Penerangan
Cara terbaik untuk memikirkan Indeks Komposit seperti yang diterapkan pada RSI adalah dengan menganggap RSI sebagai Windows 3.0 dan Indeks Komposit sebagai Windows 10. Constance Brown menemui bahawa RSI, walaupun ia mencipta dan mengesan divergensi, tidak seakurat yang sepatutnya. Ia agak bertentangan untuk mengatakan ini tetapi RSI adalah penunjuk momentum tanpa sebarang pengiraan momentum yang dilampirkan kepadanya. RSI terlepas sejumlah besar pergerakan penting dan malah menghasilkan beberapa pergerakan yang buruk. Apa yang dilakukan oleh Constance Brown dengan RSI adalah memasukkan pengiraan momentum dalam RSI itu sendiri. Indeks ini menghapuskan sekatan julat penormalan dalam RSI. Ini bermakna ia tidak terikat dalam julat 0-100.
RSI dan Indeks Komposit Bersama-sama
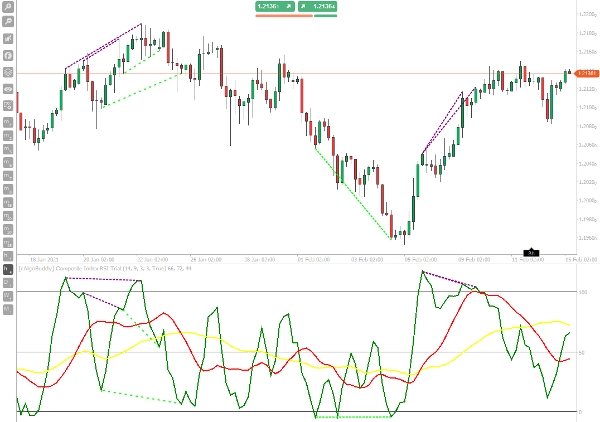
Salah satu strategi yang digunakan oleh Constance Brown dengan Indeks Komposit adalah membandingkan Indeks Komposit dengan RSI. Apabila kita mencari divergensi, kita mencari perkara seperti divergensi bullish. Divergensi bullish berlaku apabila harga mencipta paras tinggi yang lebih tinggi, tetapi osilator menunjukkan paras tinggi yang lebih rendah. Apabila kita menggunakan RSI dan Indeks Komposit bersama-sama, kita melayan RSI seperti carta harga dan Indeks Komposit adalah osilator.
Penunjuk ini mempunyai garis RSI normal dalaman untuk mengesan divergensi, jadi kerja telah dilakukan untuk anda. Dagangkan isyarat divergensi seperti mana anda menggunakan osilator lain.
Ciri utama Indeks Komposit adalah untuk mewakili momentum dengan isyarat operasi yang jelas. Jadi, apabila RSI memasuki zon terlebih beli atau terlebih jual, persilangan Indeks Komposit dengan purata bergeraknya dalam arah bertentangan mewakili isyarat dagangan yang baik, kemudian, dengan menggabungkan simbiosis momentum osilator dengan tindakan harga pada sokongan dan rintangan, anda mendapat logik dagangan yang sangat menarik dan menang, yang juga sesuai untuk dagangan dengan mata wang kripto.
Cara Menggunakan
Strategi Indeks Komposit adalah strategi tindakan harga momentum berdasarkan gabungan tahap sokongan dan rintangan dengan tahap terlebih beli dan terlebih jual Relative Strength Index dan Indeks Komposit. Indeks Komposit dalam strategi dagangan ini juga adalah masa kemasukan terakhir.
Jangka Masa: H1+, Sentiasa gunakan ini bersama RSI.
Beli
- Harga memantul pada sokongan.
- Purata Bergerak RSI Komposit berada di bawah tahap 50 dan MA cepat (Merah) lebih rendah daripada MA perlahan (kuning).
- RSI mencipta paras rendah dan nilainya hampir atau di bawah 30 dan juga Indeks Komposit mempunyai paras rendah.
- Kita masuk posisi panjang sebaik sahaja Indeks Komposit melintasi ke atas purata bergerak.
Jual
- Harga memantul pada rintangan.
- Purata Bergerak Komposit berada di atas tahap 50 dan MA cepat (Merah) lebih tinggi daripada MA perlahan (kuning)
- RSI mempunyai puncak dan nilainya hampir atau di atas 70 dan juga Indeks Komposit mempunyai puncak.
- Kita masuk posisi pendek apabila Indeks Komposit melintasi ke bawah purata bergerak (ini adalah masa untuk masuk ke pasaran).
Ringkasan
Ulasan pelanggan
5 | 0 % | |
4 | 100 % | |
3 | 0 % | |
2 | 0 % | |
1 | 0 % |


