
IR Multi Data
Gösterge
100 i̇ndirmeler
Sürüm 1.0, Jan 2025
Windows, Mac
5.0
Değerlendirmeler: 1
Açıklama
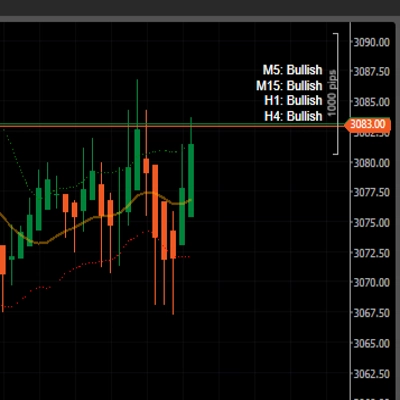
grafiğinizde sembolü ve zaman dilimini, günlük net kar yüzdesini, günlük net karı ve spread'i gösterin.
günlük karı doğru göstermek için zaman diliminin utc olarak ayarlandığını unutmayın.
Özet
Gösterge profili
Müşteri değerlendirmeleri
5.0
Değerlendirmeler: 1
5 | 100 % | |
4 | 0 % | |
3 | 0 % | |
2 | 0 % | |
1 | 0 % |
Tartışma
SSS
cTrader Store üzerinden erişilebilen işlem botları, göstergeler ve eklentiler gibi ürünler, üçüncü taraf sağlayıcılar tarafından sağlanır ve yalnızca bilgilendirme ve teknik erişim amaçlarıyla sunulur. cTrader Store bir broker değildir ve yatırım tavsiyesi, kişisel öneriler vermez veya gelecekteki performansı garanti etmez.
Bu oluşturanın diğer ürünleri


Fiyat
5.12K
Ücretsiz yüklemeler