
Açıklama
Gelişmiş Arz Talep ile Yüksek Olasılıklı Ticaret Bölgelerini Keşfedin!
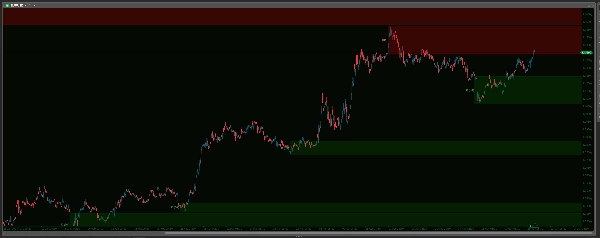
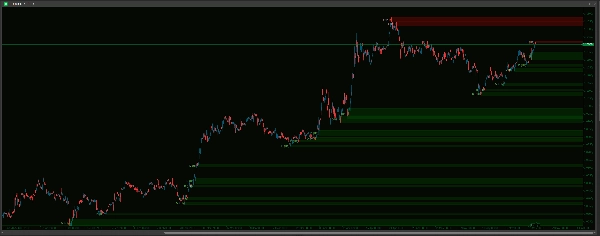
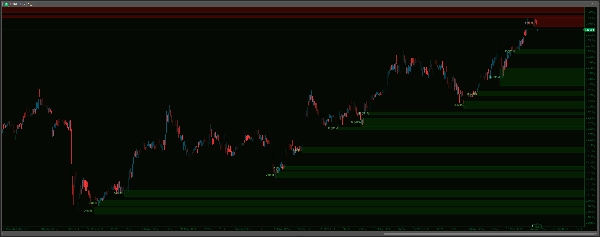
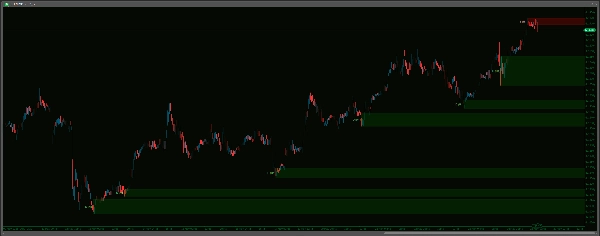
Piyasayı daha net görmek için Advanced Supply Demand Zones V2 göstergesini kullanın. Bu güçlü araç, grafiğinizde kritik arz ve talep alanlarını otomatik olarak tanımlar ve vurgular, önemli fiyat tepkilerinin nerede olabileceğini potansiyel olarak belirler. Gelişmiş bir swing-noktası tespit algoritması, çoklu zaman dilimi (MTF) özellikleri ve kapsamlı özelleştirme seçenekleri ile göstergenizi tam olarak ticaret tarzınıza göre ayarlayabilirsiniz. Kırılmış veya çakışan bölgeleri kaldırma, zaman sınırları uygulama ve grafiğinizi temiz tutma seçenekleriyle bölgeleri etkili bir şekilde yönetin. Özelleştirilebilir bölge görünümleri, net zaman dilimi etiketleri ve canlı veri tamponu ile donatılmış sağlam bir ses uyarı sistemi ile analizlerinizi geliştirin – böylece tanımladığınız bölgelere önemli fiyat yaklaşımlarında bildirim alırsınız. Teknik analizlerinizi bir üst seviyeye taşıyın ve daha bilinçli ticaret kararları verin!
-------------------
V1'e Göre İyileştirmeler:
Advanced Supply Demand V2, daha hassas, kullanıcı dostu ve etkili bir ticaret deneyimi için önemli geliştirmeler sunar:
- Daha Akıllı, Daha Sessiz Uyarılar – Tarihsel Gürültüye Son!
-
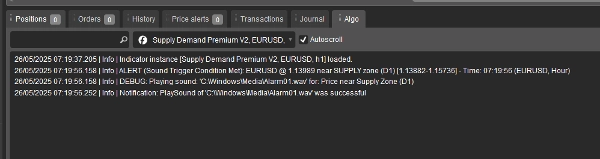
- Uyarılar, yükleme sonrası gerçek zamanlı fiyat hareketinde tetiklenir, rahatsız edici tarihsel uyarıları ortadan kaldırır! Ayrıca, dosya adlarını yazmaktan çok daha kolay olan açılır menüden seslerinizi seçebilirsiniz. Ayrıca bildirim spamını önlemek için Bölge Başına Maksimum Uyarı özelliği de vardır.
- Kolay Yapılandırma – Ayarlar Basitleştirildi!
-
- Çoğu seçenek için açılır menüler (Zaman Dilimleri, Evet/Hayır seçimleri, Çizgi Stilleri, Ses Dosyaları) ile çok daha sezgisel bir kurulumun keyfini çıkarın. Her seferinde doğru yapın!
- Daha Net Bölge Mantığı ve Yönetimi – Daha Az Karmaşa, Daha Fazla Netlik!
-
- Daha doğrudan ve uygulanabilir bir yaklaşıma sadeleştirildi. V2, kırılmış bölgeleri kaldırmak için net kurallar kullanır, grafiğinizi temiz tutmak için çakışan (örtüşen) bölgeleri akıllıca yönetir ve eski bölgeler için basit bir zaman bazlı sona erme sunar, ayrıca görüntülenen bölge sayısını sınırlama seçeneği vardır.
- Üstün Görsel Kontrol – Grafiğiniz, Kendi Tarzınız!
-
- Arz ve Talep bölgeleri için ayrı görünüm ayarları (Renk, Kalınlık, Stil) ile ayrıntılı kontrol elde edin. Görselleri tam olarak tercihinize göre ayarlayın ve bölgeleri grafikte etkileşimli hale getirin!
- Daha Esnek Bölge Tanımı!
-
- Artık
IncludeBarBodyseçeneği dahil, sadece fitil bölgeleri veya mum gövdesini de içeren bölgeler arasında seçim yaparak potansiyel olarak daha geniş ve farklı bir piyasa perspektifi sunar.
- Artık
-------------------
Ayarlar Kılavuzu: Advanced Supply Demand Zones
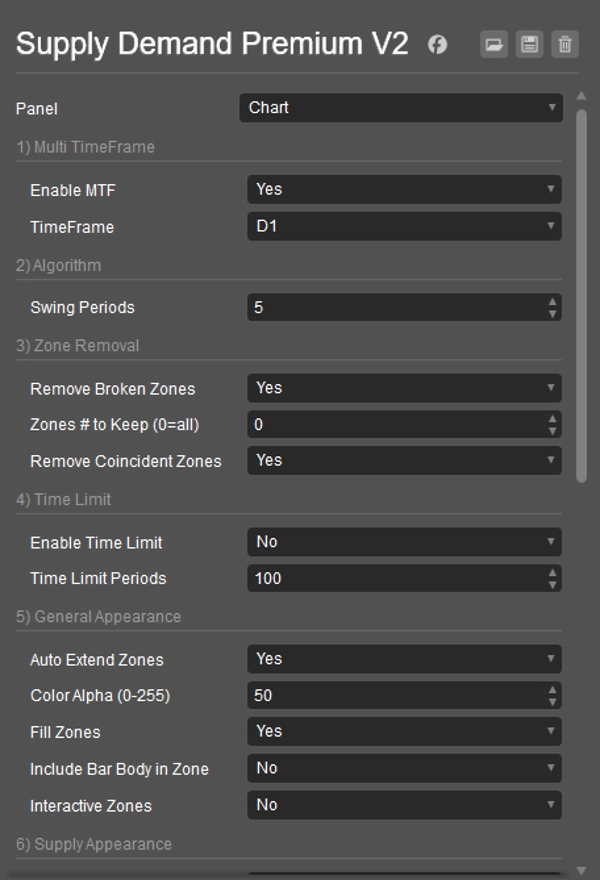
1) Çoklu Zaman Dilimi
- MTF Etkinleştir: Evet, mevcut grafikte farklı bir zaman diliminden bölgeleri görmek için. Hayır, mevcut grafik bölgeleri için.
- Zaman Dilimi: MTF Evet ise, diğer zaman dilimini burada seçin (örneğin, M15 grafikte H4 bölgeleri).
2) Algoritma
- Swing Periyotları: Bölge oluşturmak için güçlü piyasa dönüşünü (swing noktası) tanımlayan bar sayısını ayarlar. Daha yüksek sayılar daha güçlü (ve genellikle daha az) bölgeler anlamına gelir.
3) Bölge Kaldırma
- Kırılmış Bölgeleri Kaldır: Fiyat net bir şekilde bölgeyi kırdığında bölgeleri otomatik olarak silmek için Evet.
- Tutulacak Bölge Sayısı (0=hepsi): En son kaç bölgenin gösterileceğini sınırlar.
0hepsini gösterir. - Çakışan Bölgeleri Kaldır: İki bölge ağır şekilde örtüştüğünde daha eski olanı otomatik olarak kaldırmak için Evet, böylece grafik daha temiz olur.
4) Zaman Sınırı
- Zaman Sınırını Etkinleştir: Çok eski bölgelerin otomatik olarak kaybolması için Evet.
- Zaman Sınırı Periyotları: Zaman sınırı etkinse, bu kadar eski barlardan daha eski bölgeler kaldırılır.
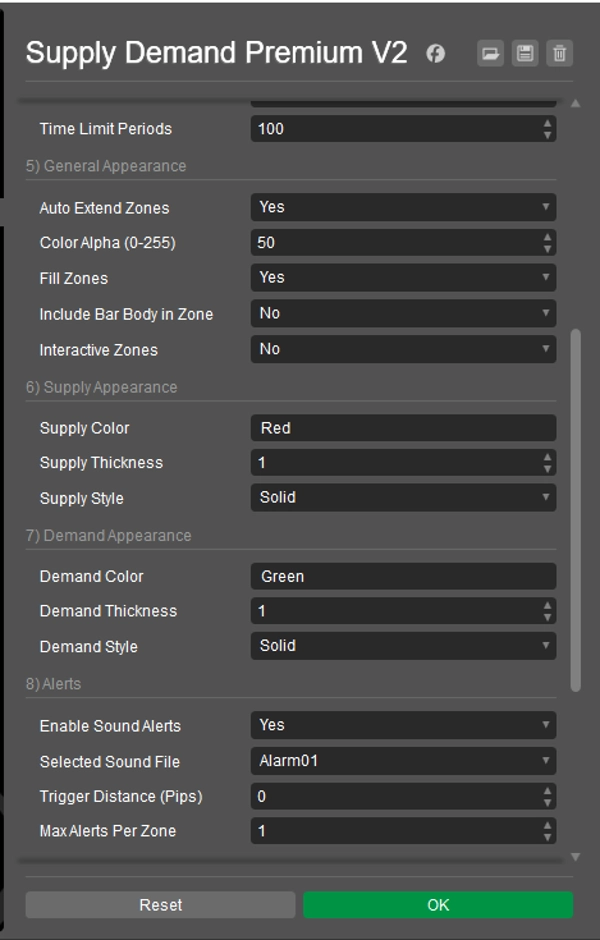
5) Genel Görünüm
- Bölgeleri Otomatik Uzat: Bölgeleri geleceğe doğru uzun çizmek için Evet. Daha kısa bölgeler için Hayır.
- Renk Alfa (0-255): Bölge renklerinin ne kadar saydam olduğunu ayarlar (0 = görünmez, 255 = opak).
- Bölgeleri Doldur: Bölgeleri renk ile doldurmak için Evet. Sadece kontur için Hayır.
- Bölgeye Mum Gövdesini Dahil Et: Bölge genişliği için mum gövdesini (ve fitilleri) kullanmak için Evet. Sadece fitilleri kullanmak için Hayır.
- Etkileşimli Bölgeler: Bölgeleri grafikte tıklayıp taşımaya izin vermek için Evet.
6) Arz Görünümü
- Arz Rengi: Arz (üst) bölgeleri için renk ayarı. (örneğin, "Kırmızı", "#FF0000")
- Arz Kalınlığı: Arz bölgeleri için sınır çizgi kalınlığı ayarı.
- Arz Stili: Arz bölgeleri için sınır çizgi stili ayarı (Düz, Noktalı, vb.).
7) Talep Görünümü
- Talep Rengi: Talep (alt) bölgeleri için renk ayarı. (örneğin, "Yeşil", "#00FF00")
- Talep Kalınlığı: Talep bölgeleri için sınır çizgi kalınlığı ayarı.
- Talep Stili: Talep bölgeleri için sınır çizgi stili ayarı (Düz, Noktalı, vb.).
8) Uyarılar Not: Eski verilerde veya başlangıçta uyarıları önlemek için, sesli uyarılar göstergenin grafiğinize yüklendiği andan itibaren 20 canlı fiyat hareketi gerçekleşene kadar aktif olmaz.
- Sesli Uyarıları Etkinleştir: Fiyat bir bölgeye yaklaştığında sesli bildirimleri açmak için Evet.
- Seçilen Ses Dosyası: Uyarılar için duymak istediğiniz sesi seçin. Sistem sesleri (örneğin "Alarm01")
C:\Windows\Media\klasöründen çalmaya çalışır; dosyanın mevcut olduğundan ve cTrader'ın erişebildiğinden emin olun. "cTraderDefaultAlert" standart bir cTrader sesini kullanır. "Hiçbiri" ses çalmaz. - Tetikleme Mesafesi (Pip): Fiyatın bir bölgenin kenarına ne kadar yakın olması gerektiğini belirler.
- Bölge Başına Maksimum Uyarı: Aynı bölge için uyarının kaç kez çalacağını sınırlar.
9) Zaman Dilimi Etiketi
- Zaman Dilimi Etiketini Göster: Her bölgede zaman dilimini (örneğin, H1, D1) göstermek için Evet.
- Arz Etiket Rengi: Arz bölgesi etiketleri için metin rengi.
- Talep Etiket Rengi: Talep bölgesi etiketleri için metin rengi.
- Etiket X Ofseti (Barlar): Etiketin bölgenin başlangıcından yatay konumunu ayarlar.
- Etiket Yazı Tipi Boyutu: Etiket metninin boyutunu ayarlar.
10) Diğerleri
- Başlangıçta Temizle: cTrader başladığında veya gösterge bir grafiğe eklendiğinde bu göstergenin eski çizimlerini kaldırmak için Evet.
- Kaldırılan Bölgeleri Yeniden Tanımla: (Bu ayar mevcut sürümde sınırlı doğrudan etkiye sahiptir. Bölgeler her tikte yeniden değerlendirilir; bir bölge için kriterler tekrar karşılanır ve kırılmış olarak kabul edilmezse, bu ayar Evet veya Hayır olsa da tekrar görünür).
----------------------------
Lütfen diğer göstergelerime de göz atmayı unutmayın:
https://ctrader.com/products/1181
https://ctrader.com/products/1182
https://ctrader.com/products/1180
https://ctrader.com/products/1015
https://ctrader.com/products/555
https://ctrader.com/products/553
https://ctrader.com/products/554
https://ctrader.com/products/552
https://ctrader.com/products/557
https://ctrader.com/products/845
https://ctrader.com/products/848
https://ctrader.com/products/847
https://ctrader.com/products/846
https://ctrader.com/products/551
https://ctrader.com/products/574
https://ctrader.com/products/573
https://ctrader.com/products/556
https://ctrader.com/products/558
https://ctrader.com/products/559
https://ctrader.com/products/560
Özet
Visual customization is granular, with separate settings for supply and demand zone colors, thickness, and line styles. Zones can be configured to include candle wicks only or both wicks and bodies, providing flexible market perspectives. Interactive zones allow users to click and move zones directly on the chart.
The alert system is designed to minimize noise by triggering notifications only on live price action after the indicator loads, with configurable sound options and limits on alert frequency per zone. Timeframe labels can be displayed on zones with customizable appearance settings.
Additional features include automatic cleanup of old drawings on startup and options to re-identify zones dynamically. This indicator aims to enhance technical analysis by clearly marking high-probability trading zones for more informed decision-making.
Müşteri değerlendirmeleri
5 | 0 % | |
4 | 100 % | |
3 | 0 % | |
2 | 0 % | |
1 | 0 % |


