
Açıklama
VWAP (Hacim Ağırlıklı Ortalama Fiyat), belirli bir dönem boyunca işlem hacmiyle ayarlanmış bir varlığın ortalama fiyatını hesaplayan bir işlem kıyaslama ölçütüdür. Gün içi işlemciler, kurumlar ve algoritmik işlem sistemleri tarafından adil değeri değerlendirmek ve işlem yürütmeyi optimize etmek için yaygın olarak kullanılır.
Ana Formül:
VWAP=∑(Price×Volume)/∑Volume
- Fiyat = Tipik fiyat (Yüksek + Düşük + Kapanış) / 3 veya sadece Kapanış fiyatı.
- Hacim = Her dönem için işlem hacmi.
2. Neden VWAP Kullanılır?
Amaç:
1)Adil Değer Referansı
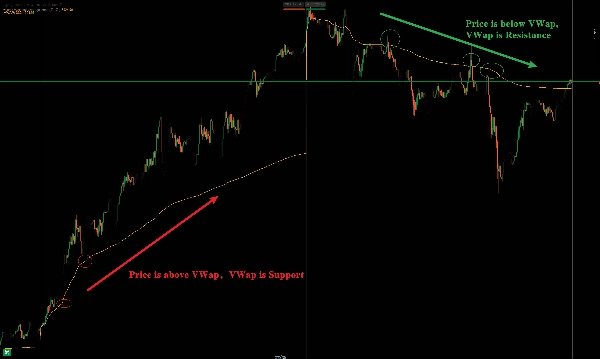
Fiyat > VWAP = Boğa eğilimi; Fiyat < VWAP = Ayı eğilimi.
2)Dinamik Destek/Direnç
Gün içi kırılmalar/geri dönüşler için önemli bir seviye olarak hareket eder.
3) Trend Onayı
Fiyat VWAP üzerinde kalıyorsa = Yükseliş trendi; altında ise = Düşüş trendi.
Hacim Ağırlıklı Ortalama Fiyat (VWAP) Göstergesi Detayları ve Kullanımı
1. Temel Kavramlar
VWAP (Hacim Ağırlıklı Ortalama Fiyat), belirli bir zaman diliminde varlığınortalama işlem fiyatını ölçmek için kullanılan teknik analiz aracıdır ve işlem hacmine göre ağırlıklandırılır. Bu, işlemcilerin mevcut fiyatın piyasa “adil değeri” ile karşılaştırmasını sağlar ve genellikle gün içi işlemler, algoritmik işlemler ve kurum emir yürütmeleri için kullanılır.
Temel Formül:
VWAP=∑(Price×Volume)/∑Volume
Her mum çubuğunun fiyatı × işlem hacmi toplanır, ardından toplam işlem hacmine bölünerek dinamik ağırlıklı ortalama fiyat elde edilir.
2. VWAP'ın Ana Kullanım Alanları
Kullanım Alanları:
1)Piyasa Adil Fiyatını Belirleme
Fiyat VWAP'ın üzerinde = Güçlü; altında = Zayıf.
2)Destek/Direnç Referansı
VWAP genellikle kısa vadeli işlemlerde dinamik destek/direnç seviyesi olarak kullanılır.
3)Gün İçi Trend Onayı
Fiyat sürekli VWAP'ın üzerinde ise = Boğalar hakim; altında ise = Ayılar hakim.
Özet
VWAP serves several key functions: it acts as a reference for fair value, where prices above VWAP indicate bullish bias and below indicate bearish bias; it provides dynamic support and resistance levels useful for intraday breakouts and reversals; and it helps confirm intraday trends, with prices sustained above VWAP signaling an uptrend and below signaling a downtrend.
This indicator supports various markets including forex, stocks, indices, commodities, and cryptocurrencies, making it a versatile tool for intraday market analysis and trading strategy development.


!["High-Low Divergence [Iridio Capital]" logosu](https://cdn.ctrader.com/image/webp/443c4661-7abb-40f1-842f-4b6ec560649b_40914)

!["[CB] Pivot Points Pro" logosu](https://cdn.ctrader.com/image/webp/43463c82-67b0-4f10-a4ba-901bba091d81_32594)


