
الوصف
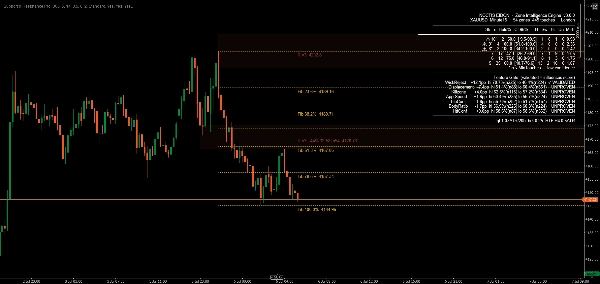
يحدد Support & Resistance Pro مناطق الدعم والمقاومة — وعلى عكس معظم أدوات S/R — يقيس ما إذا كانت تلك المناطق تعمل فعلاً، باستخدام محرك إحصائي مستقل مبني على بيانات تاريخية حقيقية بدلاً من الافتراض. كل منطقة تعرض إحصائية معدل الثبات مع فترة ثقة، محسوبة من كامل مجموعة المناطق التاريخية، بما في ذلك المناطق التي انكسرت لاحقاً واختفت من الرسم البياني. معظم المؤشرات في هذه الفئة تحسب فقط المستويات التي لا تزال مرئية اليوم، مما يضخم بهدوء كل ادعاء قوة يتم تقديمه. هذا المؤشر لا يفعل ذلك.
الميزات الرئيسية
- مناطق مُثبتة إحصائياً كل منطقة تحمل معدل ثبات حقيقي مقاس تاريخياً مع فترة ثقة 95% — ليست درجة قوة مفترضة. إشارة واحدة، رفض الفتيل عند نقطة الاتصال، تم التحقق منها رسمياً: مؤكدة على EURUSD وBitcoin، عبر أطر زمنية متعددة، بما في ذلك اختبار حقيقي خارج العينة حيث حافظ التأثير على قوته على بيانات غير مرئية.
- انعكاس الدور التلقائي الدعم المكسور يصبح تلقائياً مقاومة، والعكس صحيح، مع علامة بصرية مميزة — يتتبع المؤشر الجانب الذي تقع عليه المنطقة بالنسبة للسعر ويلونها وفقاً لذلك، بدلاً من تثبيت اللون حسب كيفية تكوين المنطقة أصلاً.
- توافق الإطار الزمني الأعلى يتم فحص المناطق على الرسم البياني الخاص بك مقابل إطار زمني أعلى تختاره، مع رسم هيكل HTF المطابق مباشرة على الرسم البياني كطبقة بصرية منفصلة.
- تكامل تصحيح فيبوناتشي مستويات تصحيح فيبوناتشي التلقائية من التأرجح الأخير، كل منها موسوم بنسبة وسعر دقيق بدقة الوسيط الخاص بك، يتم تنظيفها تلقائياً مقابل المناطق القريبة بحيث لا تتداخل التسميات أبداً.
- تحذير التشبع المناطق التي تم اختبارها مرات كثيرة يتم تمييزها بدلاً من افتراض أنها أقوى — تظهر بياناتنا أن المناطق التي تم اختبارها بشكل مكثف تميل إلى الأداء أسوأ، وليس أفضل، على الأرجح لأن السيولة المستقرة لديها قد استُنفدت بالفعل.
- بوابة التحقق المفتوحة ست إشارات مرشحة إضافية — نسبة الجسم، سرعة الاقتراب، توقيت الجلسة/منطقة القتل، واختبار الإزاحة — تُعرض مباشرة على لوحة الإحصائيات المدمجة مع قراءات معدل الثبات الخاصة بها. لا تؤثر على أي درجة أو تصنيف حتى يجتاز كل منها بشكل مستقل نفس عتبة الدليل التي اجتازها رفض الفتيل. ترى بالضبط ما تم إثباته وما لم يتم إثباته.
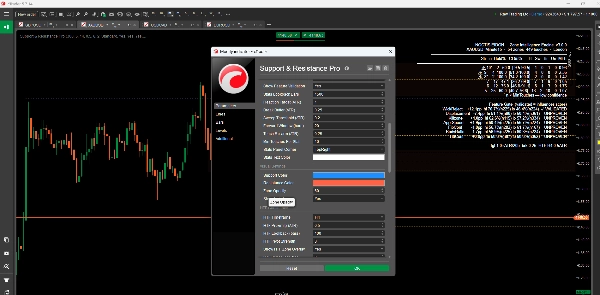
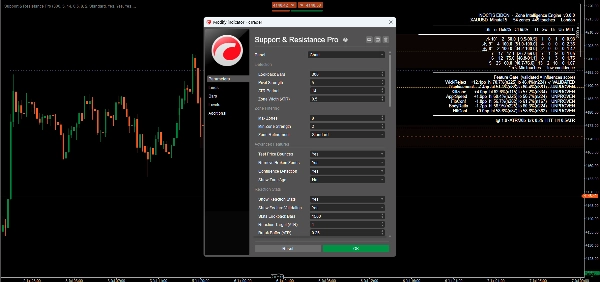
- إعدادات قابلة للتخصيص تحكم واسع في المعلمات عبر حساسية الكشف، تصفية المناطق، التنسيق البصري، وسلوك التنبيهات.
- تنبيهات في الوقت الحقيقي تنبيهات منبثقة، بريد إلكتروني، وصوتية قابلة للتكوين للمس المناطق، الاختراقات، وأحداث التوافق، يمكن تفعيلها أو تعطيلها بشكل مستقل لكل قناة.
الفوائد
- الأدلة بدل الافتراض: يمكن التحقق من كل إحصائية على الرسم البياني بشكل مستقل — يتضمن المؤشر أدوات التحقق داخل العينة وخارج العينة الخاصة به
- لا تحيز البقاء: تُبنى ادعاءات القوة على كامل مجموعة المناطق التاريخية، وليس فقط المستويات التي نجت
- إفصاح صادق: تُوسم الإشارات المثبتة وغير المثبتة على الرسم البياني، في جميع الأوقات
مثالي لـ
المتداولين الذين يرغبون في رؤية الأدلة الإحصائية وراء مستوى معين، وليس مجرد خط — المتداولين اليوميين، متداولي التأرجح، والمتداولين المنهجيين عبر الفوركس، العملات المشفرة، وأدوات أخرى يبحثون عن نهج مقاس بدقة للدعم والمقاومة.
الخلاصة
تم بناء Support & Resistance Pro حول مبدأ واحد: ادعاء القوة ليس حقيقياً حتى يتم قياسه. إشارة واحدة تجاوزت هذا العتبة مع تأكيد عبر الأدوات، الأطر الزمنية، وخارج العينة. الباقي يُعرض بصدق على أنه لا يزال قيد الاختبار — لأن رقماً لا يمكنك التحقق منه لا يستحق العرض على الإطلاق.
الملخص
- Dynamic support and resistance levels that adjust in real-time based on recent price action.
- Multi-timeframe analysis to view levels across different timeframes for a comprehensive market overview.
- Calculation and display of pivot points to mark potential intraday reversal zones and target prices.
- Highlighting of psychological price levels (round numbers) to gauge market sentiment.
- Integration of Fibonacci retracement levels to assist in identifying support and resistance during price corrections.
- Customizable settings for lookback periods, visualization styles, and color schemes to suit individual trading preferences.
- Clear graphical representation for easy identification of market conditions.
- Configurable real-time alerts when prices approach critical levels.
This indicator supports various trading styles including scalping, day trading, and swing trading, and is suitable for traders in forex, commodities, stocks, and indices markets. It is intended for both beginner and experienced traders seeking structured market analysis and enhanced decision-making through reliable support and resistance data.
تقييمات العملاء
5 | 100 % | |
4 | 0 % | |
3 | 0 % | |
2 | 0 % | |
1 | 0 % |


