

الوصف
SmartFibonacci — استردادات وتمديدات فيبوناتشي تلقائية وقابلة للتكوين مع دعم الإطارات الزمنية الأعلى، وعلامات الأسعار، وتنبيهات القرب لاتخاذ قرارات تداول أسرع وأكثر ثقة.
وصف قصير جاهز للمتجر (1–2 سطر)
يكتشف SmartFibonacci تلقائيًا نقاط الذروة والقاع ويتتبع استردادات فيبوناتشي بوضوح مع تمديدات اختيارية على الرسم البياني الخاص بك. يجعل التكوين القابل للتعديل، واكتشاف الذبذبات في إطار زمني أعلى، وعلامات الأسعار/النسب المئوية، وتنبيهات القرب منه مثاليًا لكل من التقلبات اليومية وإعدادات التداول المتأرجح.
الوصف الكامل للمنتج (جاهز للنسخ واللصق لمتجر cTrader)
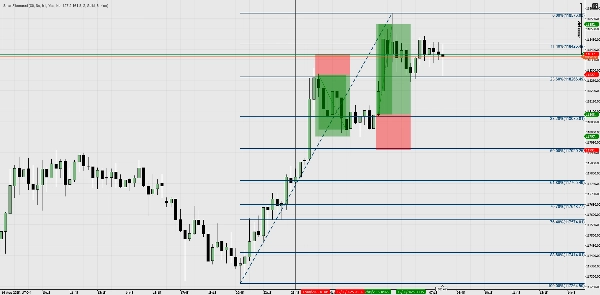
SmartFibonacci هو مؤشر خفيف الوزن يركز على الأداء لمنصة cTrader يقوم بأتمتة تحليل فيبوناتشي حتى تتمكن من قضاء وقت أقل في رسم المستويات ووقت أكثر في التداول. يحدد أحدث ذروة وقاع ضمن فترة بحث قابلة للتكوين، يرسم مستويات الاسترداد ومستويات التمديد (الإسقاط) الاختيارية، ويعرض علامات الأسعار والنسب المئوية لتفسير سريع. للحصول على إشارات قوية، يمكن لـ SmartFibonacci حساب نقاط الذبذبات على إطار زمني أعلى أثناء عرض المستويات على الرسم البياني الحالي. تنبهك التنبيهات المدمجة (نافذة منبثقة + صوت) عندما يقترب السعر ضمن مسافة قابلة للتكوين من أي مستوى فيبوناتشي مرئي.
تتضمن هذه القائمة: لقطات شاشة واضحة تظهر عناصر واجهة المستخدم الرئيسية، سير العمل النموذجي، إعدادات التكوين، ومخرجات نموذجية (علامات الأسعار، التمديدات، التنبيهات) لتسهيل تقييم المشترين للوظائف وتجربة المستخدم قبل الشراء.
الميزات الرئيسية
- الكشف التلقائي عن الذبذبات — يعثر على أحدث ذروة وقاع ضمن نافذة بحث قابلة للتكوين.
- خيار الإطار الزمني الأعلى للذبذبات — حساب نقاط الذبذبات على إطار زمني أعلى لمستويات أكثر سلاسة ومعنى.
- الاستردادات والتمديدات — رسم خطوط الاسترداد القياسية ومستويات التمديد/الإسقاط الاختيارية (نسب مئوية يحددها المستخدم مثل 127.2، 161.8، إلخ).
- علامات الأسعار والنسب المئوية — كل مستوى مرئي يعرض نسبته المئوية والسعر الدقيق لاتخاذ قرار سريع.
- المرئيات القابلة للتخصيص — تعيين الألوان (الاسترداد / التمديد)، سمك الخط ونمط الخط.
- تنبيهات القرب — نافذة منبثقة + صوت عند دخول السعر ضمن نصف قطر قابل للتكوين من مستوى فيبوناتشي مرئي؛ خيار التنبيه للمستوى الأقرب فقط.
- منطق إعادة الرسم الفعال — يعيد المؤشر الرسم فقط عندما تتغير نقاط الذبذبات لتقليل ازدحام الرسم البياني واستهلاك وحدة المعالجة المركزية.
- الإعدادات الافتراضية الآمنة — إعدادات افتراضية معقولة للمتداولين الذين يرغبون في الاستخدام الفوري بعد التثبيت.
- متوافق مع cTrader / cAlgo — مصمم ليعمل كمؤشر تراكبي.
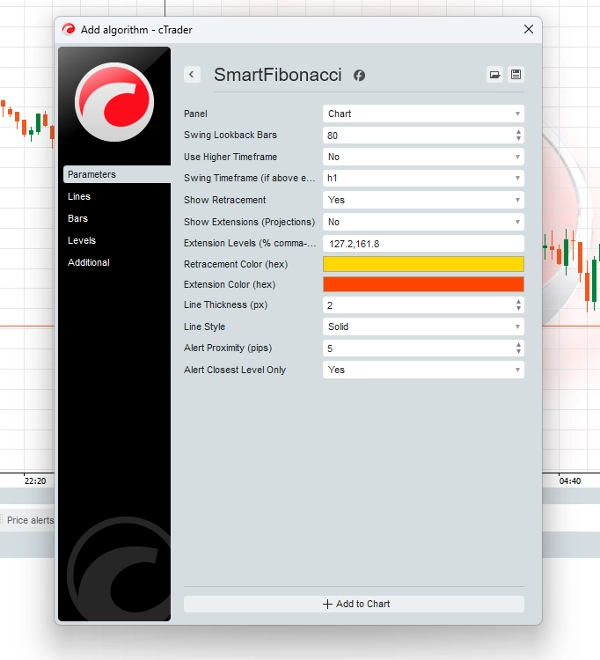
التكوين (المعلمات والتفسيرات)
- أشرطة البحث عن الذبذبات (int) — عدد الأشرطة التي يتم البحث خلالها للعثور على الذروة/القاع (الافتراضي 80).
- استخدام إطار زمني أعلى (bool) — تمكين الكشف على إطار زمني أعلى أثناء الرسم على الرسم البياني الحالي.
- إطار زمني الذبذبة (TimeFrame) — الإطار الزمني الأعلى المستخدم عند
Use Higher Timeframeمفعل. - عرض الاسترداد (bool) — تبديل رسم مستويات الاسترداد.
- عرض التمديدات (bool) — تبديل رسم مستويات التمديد/الإسقاط.
- مستويات التمديد (string) — قيم نسب مئوية مفصولة بفواصل (مثلاً،
127.2,161.8) تُستخدم لملء خطوط الإسقاط. - لون الاسترداد / لون التمديد (hex) — اختيار ألوان لخطوط الاسترداد والتمديد.
- سمك الخط (px) — إعداد سمك الخط كعدد صحيح.
- نمط الخط (enum) — اختيار نمط الخط مثل متصل، متقطع، إلخ.
- تنبيه القرب (نقاط) — المسافة بالنقاط لتنبيهات القرب.
- تنبيه المستوى الأقرب فقط (bool) — عند التفعيل، ينبه فقط أقرب مستوى فيبوناتشي بالنافذة المنبثقة.
المخرجات التحليلية وعناصر تجربة المستخدم
- خطوط على الرسم البياني — خطوط الاسترداد والتمديد مع علامات نسب مئوية واضحة (مثلاً، 61.8%) وعلامات أسعار (مثلاً، 1.23456).
- إشعارات منبثقة — يتلقى المستخدم نافذة منبثقة على الشاشة وصوت النظام عندما يدخل السعر منطقة
Alert Proximity. - إعادة رسم غير متطفلة — يتم التحديث فقط عندما تتغير الذبذبات المكتشفة لتجنب وميض إعادة الرسم المتكرر.
- اتساق مصدر السعر — يتم حساب التنبيهات والعلامات باستخدام نفس سلسلة الأشرطة التي تم رسم الفيبوناتشي عليها (مهم عند استخدام حساب الإطار الزمني الأعلى).
سيناريوهات سير العمل / الاستخدام النموذجية
- إعداد سريع (سكالبينغ / تداول يومي)
-
- قم بإرفاق SmartFibonacci على مخطط 5 دقائق، واضبط
Lookback = 80،ShowRetrace = true. - راقب مستويات الاسترداد واستخدم 61.8% / 50% كمناطق تفاعل داخل اليوم.
- فعّل
Alert Proximity = 5 pipsلتتلقى إشعارات عند اقتراب السعر من المستويات المهمة.
- قم بإرفاق SmartFibonacci على مخطط 5 دقائق، واضبط
- سياق الإطار الزمني الأعلى (تداول متأرجح)
-
- اضبط
Use Higher Timeframe = trueواخترHigher Timeframe = H4(أو يومي). - تعكس المستويات ذبذبات H4 أثناء التداول على H1 أو M30 — توافق أفضل مع هيكل الإطار الزمني الأعلى.
- استخدم التمديدات (127.2، 161.8) كأهداف ربح للتداول المتأرجح.
- اضبط
- التحقق + التلاقي
-
- ادمج مستويات SmartFibonacci مع دعمك/مقاومتك الحالية، كسر الهيكل، أو المتوسطات المتحركة للتحقق من نقاط الدخول.
- استخدم التنبيهات المنبثقة لتوقيت الدخول أو سجل التفاعلات للاختبار الخلفي.
- سير العمل المعتمد على التنبيهات
-
- احتفظ بالمؤشر قيد التشغيل أثناء مراقبة عدة مخططات؛ استقبل نوافذ منبثقة عند اقتراب السعر من أي مستوى فيبوناتشي مرئي وقم بالتصرف وفقًا لذلك.
الملخص
تقييمات العملاء
5 | 100 % | |
4 | 0 % | |
3 | 0 % | |
2 | 0 % | |
1 | 0 % |


![شعار "[Stellar Strategies] Inside Bar with Signals"](https://cdn.ctrader.com/image/webp/1d9e8bfa-3b2c-4440-bb37-5856902008a7_30683)


