
الوصف
MACD Pro Trader – المؤشر النهائي لتداول MACD 🚀
هل تبحث عن مؤشر MACD قوي واحترافي لتعزيز استراتيجية التداول الخاصة بك؟ MACD Pro Trader هو الأداة النهائية المصممة للمتداولين الذين يريدون الدقة والوضوح والإشارات عالية الأداء في قرارات التداول الخاصة بهم. سواء كنت مبتدئًا أو متداولًا ذا خبرة، سيساعدك هذا المؤشر المتقدم لـ MACD على تحديد اتجاهات السوق، واكتشاف إعدادات تداول ذات احتمالية عالية، وتعظيم أرباحك بثقة!
🔥 لماذا تختار MACD Pro Trader؟
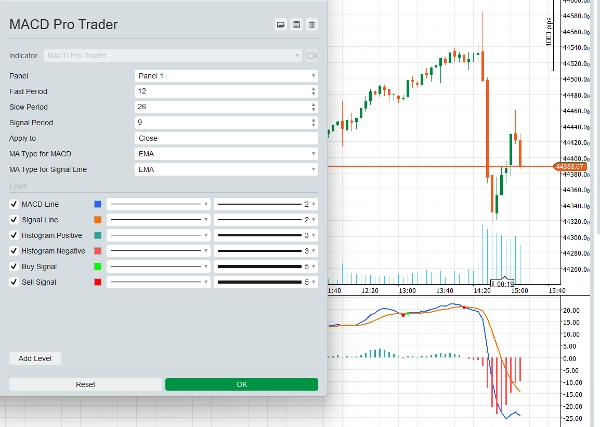
✅ تخصيص متقدم للمتوسط المتحرك – اختر بين SMA (المتوسط المتحرك البسيط) أو EMA (المتوسط المتحرك الأسي) لكل من خط MACD وخط الإشارة، مما يمنحك السيطرة الكاملة على كيفية تكيّف المؤشر مع ظروف السوق المختلفة.
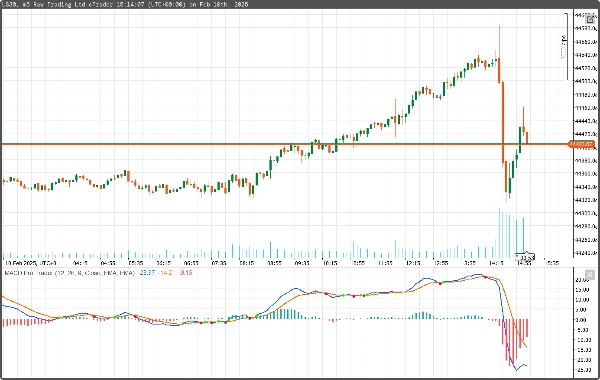
✅ إشارات شراء وبيع ذكية – احصل على إشارات دخول وخروج واضحة مع علامات خضراء وحمراء مميزة بصريًا تشير إلى متى يعبر خط MACD خط الإشارة. لا مزيد من التخمين في دخول الصفقات!
✅ مخطط هيستوجرام ثنائي اللون لتصور أفضل للاتجاه – يتم ترميز أشرطة الهيستوجرام الإيجابية والسلبية بالألوان، مما يساعدك على رؤية تغير الزخم لصالحك على الفور.
✅ خيارات مرنة للسعر المطبق – طبق حسابات MACD على أسعار الافتتاح، الأعلى، الأدنى، الإغلاق، المتوسط، النموذجي، أو المرجح لضبط المؤشر وفقًا لأسلوب تداولك.
✅ مثالي للتداول اليومي وتداول السوينغ – مصمم للعمل على الفوركس، الأسهم، المؤشرات، والعملات المشفرة، سواء كنت تقوم بالتداول السريع على مخطط الدقيقة الواحدة أو التداول على إطار زمني 4 ساعات.
✅ تكامل سلس مع cTrader – مُحسّن بالكامل لـ cTrader مع أداء في الوقت الحقيقي وتأخير ضئيل، مما يمنحك ميزة على مؤشرات MACD التقليدية.
📈 كيفية استخدام MACD Pro Trader للتداول اليومي
الاستراتيجية: تقاطع MACD + تأكيد الزخم
تم تصميم هذه الاستراتيجية البسيطة لكنها القوية لالتقاط تحركات السعر قصيرة الأجل وتعظيم الأرباح في الأسواق المتجهة.
🔹 الخطوة 1: تحديد الاتجاه
- استخدم تقاطع خط MACD وخط الإشارة كمؤشر أولي.
- ابحث عن تقاطع MACD فوق خط الإشارة لإعداد صعودي.
- ابحث عن تقاطع MACD تحت خط الإشارة لإعداد هبوطي.
🔹 الخطوة 2: التأكيد باستخدام الهيستوجرام
- يؤكد نمو الهيستوجرام الإيجابي وجود زخم صعودي قوي.
- يؤكد نمو الهيستوجرام السلبي وجود زخم هبوطي قوي.
- إذا كان الهيستوجرام ضعيفًا أو مستويًا، انتظر إشارة أقوى.
🔹 الخطوة 3: دخول الصفقة
- دخول شراء: عندما يعبر MACD فوق خط الإشارة و يتحول الهيستوجرام إلى اللون الأخضر.
- دخول بيع: عندما يعبر MACD تحت خط الإشارة و يتحول الهيستوجرام إلى اللون الأحمر.
🔹 الخطوة 4: تعيين وقف الخسارة وجني الأرباح
- وقف الخسارة: ضع وقف الخسارة الخاص بك أسفل أدنى نقطة تأرجح حديثة (للشراء) أو فوق أعلى نقطة تأرجح حديثة (للبيع).
- جني الأرباح: استهدف ضعف وقف الخسارة لتحقيق نسبة مخاطرة إلى مكافأة جيدة (مثلاً، المخاطرة بـ 10 نقاط لكسب 20 نقطة).
🔹 نصيحة إضافية: استخدم أطر زمنية أعلى للتأكيد
قبل دخول الصفقة، تحقق من الإطار الزمني الأعلى (مثلاً، 15 دقيقة إذا كنت تتداول على 5 دقائق) لتأكيد اتجاه الاتجاه. إذا توافقت الإطارات الزمنية، فإن فرص نجاح صفقتك تكون أعلى!
🎯 لمن يناسب MACD Pro Trader؟
✅ متداولي الفوركس الباحثين عن إشارات MACD عالية الدقة.
✅ المتداولين السريعين واليومي الذين يحتاجون إلى نقاط دخول سريعة وموثوقة.
✅ متداولي الأسهم والعملات المشفرة الذين يرغبون في ركوب الاتجاهات بثقة.
✅ متداولي السوينغ الذين يريدون تحديد تحولات الزخم طويلة الأجل.
إذا كنت متعبًا من فقدان الصفقات الجيدة أو تعاني في توقيت دخولك، فـ MACD Pro Trader هو الحل الذي كنت تنتظره!
💎 احصل على MACD Pro Trader اليوم وارتقِ بتداولك إلى المستوى التالي!
🔹 محسن 100% لـ cTrader – بدون تأخير، بدون إعادة رسم، فقط إشارات نظيفة وقابلة للتنفيذ.
🔹 تحميل فوري – ابدأ في استخدامه خلال دقائق!
🔹 تحديثات مدى الحياة – احصل على جميع التحسينات المستقبلية بدون تكلفة إضافية.
📥 احصل على نسختك الآن وابدأ التداول بذكاء! 🚀
الملخص
A dual-tone histogram visually represents momentum shifts with color-coded positive and negative bars, enhancing trend analysis. Users can apply MACD calculations to various price types including Open, High, Low, Close, Median, Typical, or Weighted prices to tailor the indicator to their trading style.
MACD Pro Trader is suitable for scalpers, day traders, swing traders, and those seeking to identify both short-term and long-term momentum changes. It is optimized for real-time performance with minimal lag on cTrader. The product includes a recommended trading strategy based on MACD line and Signal line crossovers confirmed by histogram momentum, with guidance on entry, stop loss, and take profit placement. Higher timeframe confirmation is suggested to improve trade probability. The indicator supports multiple timeframes from 1-minute scalping to 4-hour swing trading.
تقييمات العملاء
5 | 50 % | |
4 | 50 % | |
3 | 0 % | |
2 | 0 % | |
1 | 0 % |


