
الوصف
🏆 أكثر من 10,000 متداول يثقون في مجموعة خوارزمياتنا التي تزيد عن 25! 🏆
من هيكل السوق والسيولة إلى أنظمة الخروج الذكية والأدوات التنبؤية - لقد بنينا كل أداة تحتاجها للثبات.
👉 الوصول إلى جميع الأنظمة المثبتة الـ 25+:
_______________________________________________
📌 مؤشرات هيكل السوق
· ✅ هيكل السوق المتقدم: Bos, Choch, SwinLevels, كتل الأوامر، محدد هيكل السوقوالسيولة
· 🔄تحليل هيكل السوق الديناميكي لنقاط التحول
· 🧱 كتلة الأوامر
· ⚖️ اختلال السوق
· ⛓️ BOS & CHOCH
· 🧠 ICT قوة 3
_______________________________________________
🔚 أنظمة الخروج الذكية
_______________________________________________
📐 مؤشرات ZigZag
· 🧭 S&R هيكل ZigZag
· ➖ ZigZag
_______________________________________________
🧱 مؤشرات الدعم والمقاومة
· 🟩 خطوط دعم ومقاومة SmartTrend
· 🧱 جميع مستويات الدعم والمقاومة
_______________________________________________
📊 مؤشرات الاتجاه والقناة
· 📊 سوبرتريند
· ⭐ قناة SSL المميزة
_______________________________________________
💧 أدوات الحجم والسيولة
· 📉 خريطة تصفية الرافعة المالية
_______________________________________________
⚡ مؤشرات الزخم و RSI
· 📈 مُشغل اتجاه RSI
· 🔎 تتبع تحيز الشمعة متعددة المستويات
Tracker
_______________________________________________
🔮 أدوات التنبؤ والإسقاط
· 📐 التنبؤ بناءً على Linreg & ATR
· 📏 انحدار خطي فيبوناتشي متعدد الأطر الزمنية
· 📈 عارض تدفق السوق المدعوم بالحجم_________________________
_________________________________________________________________________________________________
_________________________________________________________________________________________________
ZigZag Structure Pro – 🚀
يحدد تلقائيًا نقاط التحول الهامة في السوق (القمم والقيعان الرئيسية) و يرسم مناطق دعم ومقاومة ديناميكية تتحدث في الوقت الحقيقي. 🎯 على عكس المستويات الثابتة التقليدية، هذا المؤشر يتكيف باستمرار مع هيكل السعر المتغير.
ما الغرض منه؟ ❓
هذا المؤشر هو أداة تحليل فني احترافية مصممة لـ:
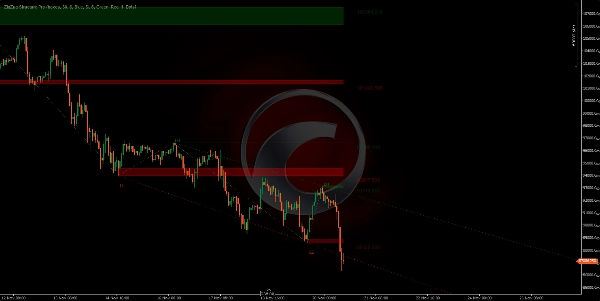
- تحديد المستويات المؤسسية: 🏛️ يكتشف تلقائيًا النقاط التي شكل فيها السعر هياكل عالية ومنخفضة مهمة.
- تحليل هيكل السوق: 📊 يصنف كل حركة وفقًا لمنهجية الهيكل الصاعد/الهابط (قمم أعلى، قيعان أدنى، إلخ).
- توقع الاتجاه: 🔮 يمد خطوط الاتجاه إلى المستقبل لتوقع مناطق رد فعل السعر المحتملة.
- تداول الانعكاسات والاستمراريات: 💰 المستويات المعلمة تعمل كمرجع للدخول، وقف الخسارة، وأهداف الربح.
يرسم المؤشر على الرسم البياني الخاص بك: ✍️
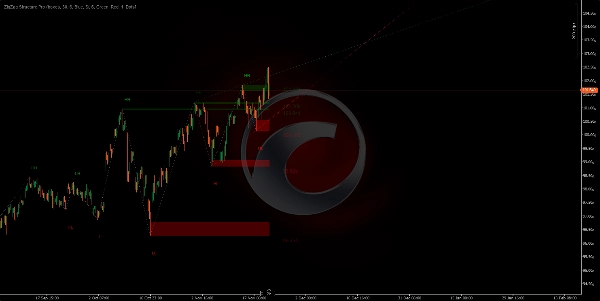
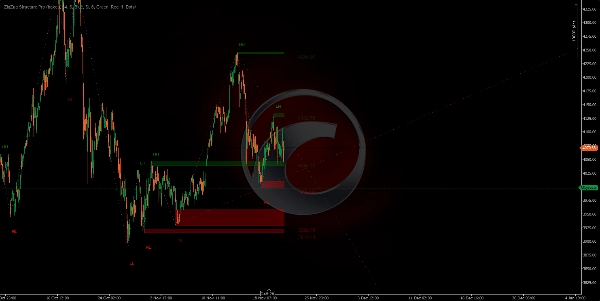
1. مناطق الدعم/المقاومة (مستطيلات)
- المناطق الخضراء: 🟢 تحدد مناطق الدعم (القيعان المهمة حيث يمكن للسعر الارتداد).
- المناطق الحمراء: 🔴 تحدد مناطق المقاومة (القمم المهمة حيث يمكن للسعر التراجع).
- هذه المناطق تُسقط إلى الأمام، مظهرة المستويات النشطة الحالية.
- سمك كل منطقة يمثل جسم الشمعة التي تشكل فيها المحور.
https://chartshots.spotware.com/c/691f5a4d75ac4
https://chartshots.spotware.com/c/691f6b4f2e98b
https://chartshots.spotware.com/c/691f6c6fda808
https://chartshots.spotware.com/c/691f6d0aa6155
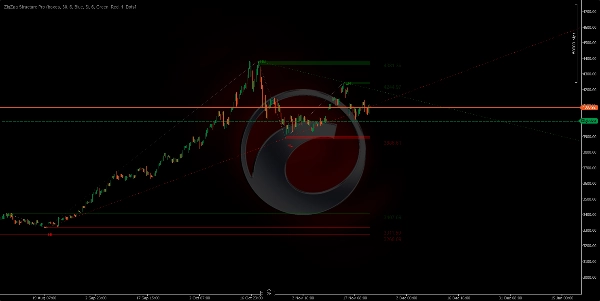
2. خطوط الاتصال ⚡
- تربط كل محور بالذي يليه، مكونة نمط "زيجزاج" بصري.
- تزيل ضوضاء السوق، مظهرة فقط الحركات المهمة حقًا.
- تجعل من السهل رؤية اتجاه وهيكل الاتجاه بنظرة سريعة.
3. خطوط الاتجاه المتوقعة (أخضر/أحمر ممتد)
- مرسومة من المحور السابق إلى الحالي و ممتدة إلى المستقبل.
- الأخضر: 🟢 خطوط اتجاه صاعدة (من القيعان).
- الأحمر: 🔴 خطوط اتجاه هابطة (من القمم).
- يُظهر آخر خطي اتجاه نشطين.
- مفيد لاكتشاف اختراقات الاتجاه أو الاحترام.
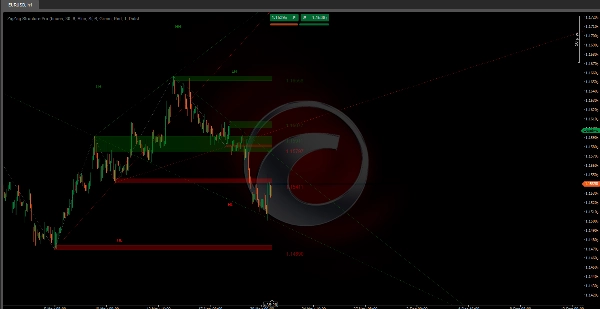
4. تسميات هيكل السوق 🏷️
كل محور يظهر تسمية تشير إلى تصنيفه:
- HH (قمة أعلى): ↗️ قمة أعلى - استمرار صاعد.
- LH (قمة أدنى): ⬆️ قمة أدنى - احتمال انعكاس هابط.
- HL (قاع أعلى): ⬇️ قاع أعلى - احتمال انعكاس صاعد.
- LL (قاع أدنى): ↘️ قاع أدنى - استمرار هابط.
المنطق وراء الخوارزمية 🧠
يستخدم المؤشر خوارزمية زيجزاج تكيفية التي:
- تفحص السعر بحثًا عن القمم والقيعان ضمن فترة قابلة للتكوين (الافتراضي 34 شمعة).
- تفلتر الحركات غير المهمة من خلال حد انحراف أدنى (الافتراضي 6 نقاط).
- تتحقق من صحة كل محور مؤكدة أنه يمثل تغييرًا حقيقيًا في هيكل السوق.
- تقارن الهياكل بين المحاور المتتالية لتصنيف نوع الحركة.
- تحدث المناطق ديناميكيًا مع ظهور محاور جديدة، مع إزالة الأقدم.
الإعدادات الرئيسية ⚙️
- أشرطة الرجوع للمحور: تتحكم في حساسية كاشف المحور (الأقل = محاور أكثر، الأعلى = محاور رئيسية فقط).
- مرشح انحراف السعر: مرشح الضوضاء - يتم تجاهل الحركات الأصغر من هذه القيمة.
- الحد الأقصى للمناطق المرئية: عدد المستويات التاريخية التي تبقى مرئية (من 1 إلى 20).
- نوع عرض المنطقة: اختر بين المستطيلات (مناطق كاملة) أو الخطوط البسيطة.
- عرض خطوط الاتجاه الممتدة: تفعيل/تعطيل توقعات الاتجاه.
دليل المعلمات السريع 📖
أشرطة الرجوع للمحور (الافتراضي: 30)
- ↑ زيادة (40-100): محاور أقل، أكثر أهمية. لـ تداول السوينغ.
- ↓ نقصان (15-25): محاور أكثر، إشارات أكثر. لـ التداول السريع/اليومي.
مرشح انحراف السعر (الافتراضي: 6)
- ↑ زيادة (8-15): يفلتر الضوضاء، فقط الحركات الكبيرة. إشارات أقل، جودة أعلى.
- ↓ نقصان (2-5): أكثر حساسية، يلتقط الحركات الصغيرة. إشارات أكثر.
الحد الأقصى للمناطق المرئية (الافتراضي: 6)
- ↑ زيادة (10-20): مستويات تاريخية أكثر مرئية. للتحليل العميق.
- ↓ نقصان (2-4): فقط المستويات الحديثة. رسم بياني نظيف.
حد المحاور التاريخية (الافتراضي: 200)
- ↑ زيادة (300-500): تاريخ أكثر للحسابات. تحليل طويل الأمد.
- ↓ نقصان (50-150): هيكل حديث فقط. أداء أفضل.
عدد الإسقاطات النشطة (الافتراضي: 5)
- ↑ زيادة (5-10): المزيد من خطوط الاتجاه المتوقعة.
- ↓ نقصان (1-2): فقط الاتجاهات السائدة. وضوح أكثر.
عرض خطوط الاتجاه الممتدة (نعم/لا)
- مفعل: يعرض الاتجاهات إلى المستقبل.
- معطل: فقط زيجزاج تاريخي.
🎯 إعدادات سريعة
- التداول السريع: رجوع 15-20 | انحراف 3-5 | مناطق 3-4
- التداول اليومي: رجوع 25-35 | انحراف 6-8 | مناطق 5-6
- تداول السوينغ: رجوع 40-60 | انحراف 10-15 | مناطق 8-12
الملخص
تقييمات العملاء
5 | 0 % | |
4 | 100 % | |
3 | 0 % | |
2 | 0 % | |
1 | 0 % |


![شعار "[Hamster-Coder] Moving Average MTF"](https://cdn.ctrader.com/image/webp/b11b98b1-194d-4b8e-b00e-d611826ad159_31226)


