
الوصف
مؤشرات متجر Pinescriptlabs: متجر Pinescriptlabs cBots : (cBot) اختراق الذهب و BTCنقاط محورية للجلسة(جديد)
هيكل السوق المتقدم: Bos, Choch, SwinLevels, كتل الأوامر، مكتشف هيكل السوق والسيولة (جديد)
خوارزمية ذكية متتبعة (جديد)
تحليل
هيكل السوق الديناميكي
لنقاط
الانعطاف
النقاط
انحدار خطي فيبوناتشي
متعدد الأطر الزمنية
الانحدار
متعدد المستويات
تتبع تحيز الشمعة
المتعقب
جميع
مستويات الدعم والمقاومة
المستويات
مناطق العرض والطلب
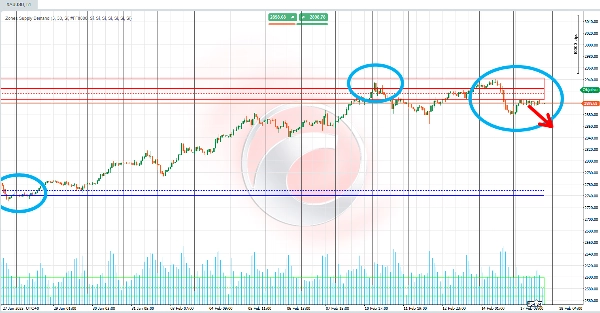
يقوم الخوارزم بتحليل حركة السعر من خلال تراكم الحجم، مقسمًا نطاق السعر المرئي (من الأعلى إلى الأدنى) إلى عدة مقاطع أو "فواصل". 📏 لكل فاصل، يحسب الحجم المتولد ويقارنها بـ نسبة عتبة محددة مسبقًا. الهدف؟ تحديد المستويات التي يكون فيها تركيز الحجم مرتفعًا جدًا بحيث يشير إلى منطقة عرض أو منطقة طلب! 🎯
📉 بالنسبة لمنطقة العرض:
- ابدأ من أعلى سعر وتحرك للأسفل عبر الفواصل.
- تراكم الحجم في كل مقطع.
- عندما يتجاوز الحجم المتراكم العتبة، يتم تحديد منطقة العرض 🚨.
- يتم رسم منطقة ملونة (مستطيل بشفافية محددة) من هذا المستوى إلى الأعلى، مع خطوط أفقية تظهر المتوسطات البسيطة والمرجحة لأسعار هذه المنطقة. 🖍️
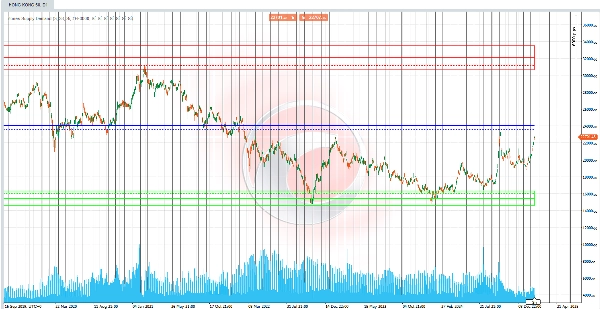
📈 بالنسبة لمنطقة الطلب:
- ابدأ من أدنى سعر وتحرك للأعلى عبر الفواصل.
- تراكم الحجم في كل مقطع.
- عندما يتجاوز الحجم المتراكم العتبة، يتم تحديد منطقة الطلب 🚨.
- يتم رسم منطقة مقابلة، مع خطوط متوسط لتسليط الضوء على مستوى التركيز المتوسط. 🖌️
⚖️ توازن السوق:
عندما يتم تحديد كل من مناطق العرض والطلب، يحسب الخوارزم نقطة توازن السوق! 🌟 يتم اشتقاق هذا التوازن من المتوسط (البسيط أو المرجح بالحجم) بين المنطقتين. النتيجة؟ خطوط مرجعية واضحة على الرسم البياني تُظهر التوازن بين ضغط الشراء والبيع! ⚖️✨
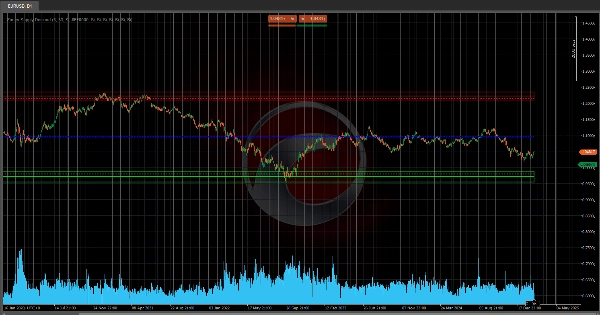
✅ باختصار:
يستخدم مؤشر "مناطق العرض والطلب" تقسيم السعر بناءً على الحجم لاكتشاف المناطق الرئيسية لتركيز الأوامر. 🗝️ ثم يولد إشارات بصرية (مناطق ملونة، خطوط متوسط، ونقاط توازن) لتسليط الضوء على المستويات الحرجة على الرسم البياني، مما يمكّن المتداولين من رصد اختلالات العرض والطلب ونقاط الانعطاف المحتملة! 🚀💡
الملخص
تقييمات العملاء
5 | 0 % | |
4 | 50 % | |
3 | 50 % | |
2 | 0 % | |
1 | 0 % |


