
DMI 3 bar v2
مؤشر
2 عمليات الشراء
الإصدار 1.0، Dec 2024
Windows, Mac
5.0
التقييمات: 1
الوصف
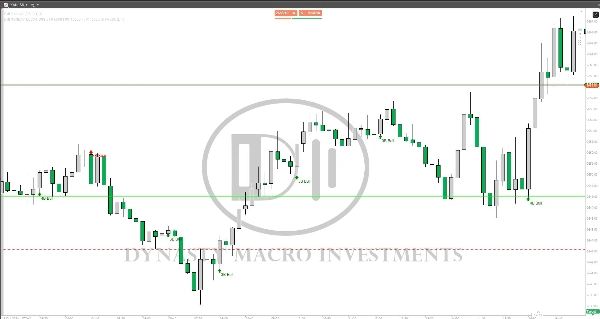
يعرض إشارات الشراء والبيع لنمط 3 و 4 أشرطة (نجمة الصباح / نجمة المساء). يمكن تعديله وسيعرض الأسهم.
الملخص
ملخص الذكاء الاصطناعي
DMI 3 bar v2 is a technical indicator designed to identify BUY and SELL signals based on 3 and 4 bar candlestick patterns, specifically the Morning Star and Evening Star formations. The indicator is adjustable to user preferences and visually displays signals using arrows on the chart. It supports pattern recognition to assist traders in decision-making by highlighting potential reversal points indicated by these classic candlestick patterns.
ملف تعريف المؤشر
تقييمات العملاء
5.0
التقييمات: 1
5 | 100 % | |
4 | 0 % | |
3 | 0 % | |
2 | 0 % | |
1 | 0 % |
مناقشة
الأسئلة الشائعة
يتم توفير المنتجات المتاحة من خلال cTrader Store، بما في ذلك روبوتات التداول والمؤشرات والإضافات، من قبل مطوري الطرف الثالث وإتاحتها لأغراض الوصول المعلوماتي والفني فقط. cTrader Store ليس وسيطًا ولا يقدم نصائح استثمارية أو توصيات شخصية أو أي ضمان للأداء المستقبلي.
المزيد من هذا المؤلف


السعر
2
المبيعات