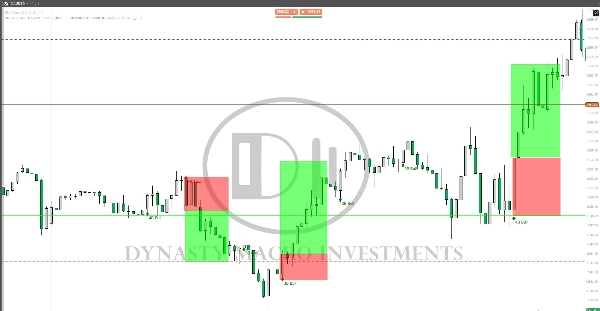
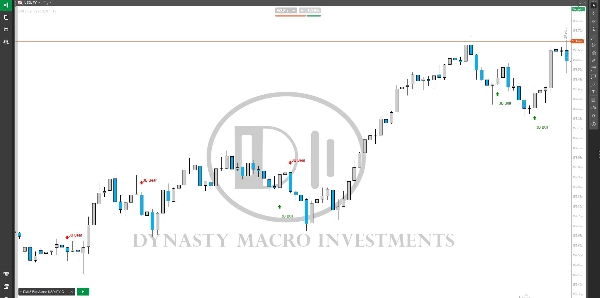
شعار "Morning Star On Chart"
Morning Star On Chart
صورة "Morning Star On Chart" المحملة
1
المبيعات

Morning Star pattern on chart (Bullish and Bearish) automatically marked with (BUY & SELL) Very powerful signals.

Indicator profile
0.0
التقييمات: 0
تقييمات العملاء
لا توجد تقييمات لهذا المنتج حتى الآن. هل جرَّبته بالفعل؟ كن أول من يخبر الآخرين!
Products available through cTrader Store, including trading bots, indicators and plugins, are provided by third-party developers and made available for informational and technical access purposes only. cTrader Store is not a broker and does not provide investment advice, personal recommendations or any guarantee of future performance.

المزيد من هذا المؤلف

Shows BUY & SELL signals for 3 & 4 BAR PATTERN (Morning star/ Evening star). It is adjustable and it will SHOW ARROWS.
This will allow you to have SESSIONS on the chart. London, New York, Asian session and you can customize the times.
Marks Monday's OPEN,HIGH & LOW. These are areas of support and resistance for the week.

قد يعجبك أيضًا

Auto-detect supply & demand zones, remove broken levels, and trade smarter with real-time alerts. Precision made simple.
MA-based trend activator with four MTF modes, timeframe pattern resolution, and trendline projection.
FREE Global Trading Sessions Indicator
The One — full control over timing and levels, the point where my market feeling shifted from a game to real structure.
Market Sessions is very important for traders.
Unlock the power of a professional-grade indicator that brings together the most effective tools in technical analysis.
The Darvas Box involves identifying "boxes" or trading ranges where a stock's price consolidates before breaking out.
⚡Nebula Range Filter is a professional trend filter indicator for cTrader⚡
Super trend with support and resistance levels
This indicator consists of 3 moving averages that can be configured to your liking, from the type of moving average....
What Constance Brown did with the RSI was to input a momentum calculation within the RSI itself. This the Composite RSI.
SSL Channel with MTF modes, timeframe pattern, ATR envelope, and bar coloring.
Where price swings, volume speaks
Dynamic circles visualize price's volatility position. Like RSI for market overextension & stretch. Quantify context.
Comprehensive SMC tool: swing & internal structure, Orderblock detection,equal highs/lows,premium/equilibrium/discount.
KAMA Keltner – Adaptive Volatility Channel for Precision Trading
This Indicator will show you Direction, Distance, and Time;
Unlock Stochastic RSI PRO in cTrader! Overlay RSI, highlight zones, and identify divergences with customizable settings.
1
المبيعات