

LT_Ind_Candles
مؤشر
4 عمليات الشراء
الإصدار 1.0، Sep 2024
Windows, Mac
4.0
التقييمات: 2

منذ 25/09/2024
38
المبيعات
الوصف
ملاحظة: تم الاختبار على cTrader لنظام ويندوز فقط.
أنماط الشمعة الواحدة:
- دوجي
- مطرقة
- نجم طائر
أنماط الشمعتين:
- ابتلاع
- سحابة داكنة
- اختراق
- هارامي
أنماط الشموع الثلاث:
- نجوم الصباح
- نجوم المساء
ماروبوزو:
إذا تم اختياره، يتم توضيح حجم الشموع ذات الجسم الكبير. اقرأ وصف الإعدادات للحجم.
الإعدادات:
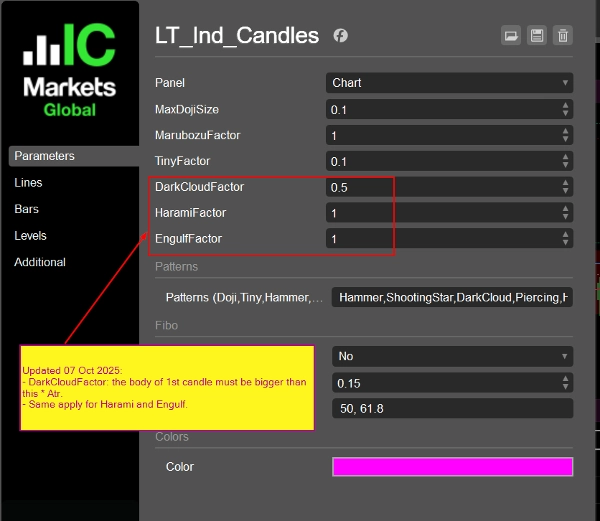
(تم التحديث 07 أكتوبر 2025:
- استخدام Atr (14 فترة، المتوسط المتحرك البسيط) بدلاً من MedianBarBody
- تمت إضافة إعدادات لعوامل DarkCloud (و Piercing)، Harami، و Engulf
)
- MaxDojiSize: النسبة القصوى بين جسم الشمعة ونطاق الشمعة للنظر في أنها دوجي (الافتراضي 0.1).
- عامل ماروبوزو: يجب أن يكون جسم الشمعة الحالي أكبر من MarubozuFactor * Atr ليعتبر شمعة كبيرة (ماروبوزو). لا نهتم بالفتيل هنا.
- استخدام النطاق لماروبوزو: استخدم BarRange (الأعلى - الأدنى) بدلاً من BarBody (الافتتاح - الإغلاق). MathAbs() عند التحقق من ماروبوزو.
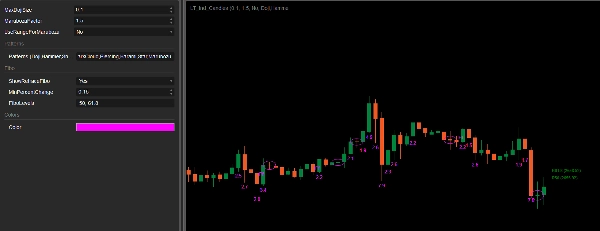
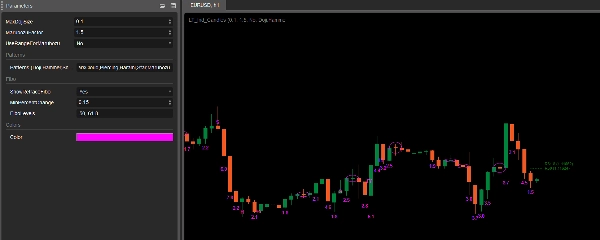
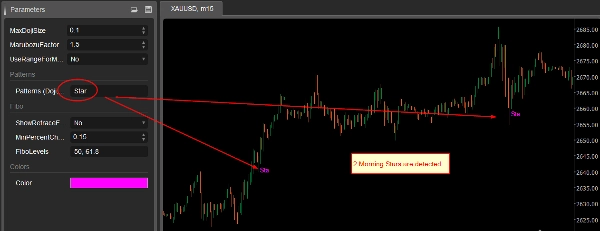
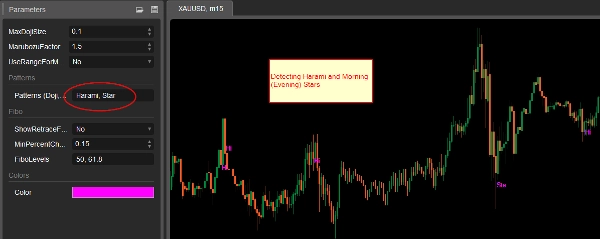
- الأنماط: ضع الأنماط التي تريد اكتشافها، مفصولة بفواصل. القيم المقبولة هي: Doji, Hammer, ShootingStar, Engulf, DarkCloud, Piercing, Harami, Star, Marubozu. لاحظ أنه إذا اخترت "Star"، سيتم اكتشاف كل من نجوم الصباح ونجوم المساء.
- عرض فيبو التصحيحي: مستويات فيبو مساعدة لمساعدتك في التحكم بالمخاطر. عندما تكون هناك شمعتان متتاليتان ذات ارتفاع أعلى وقاع أعلى، يتم رسم مستويات فيبو المحددة المحسوبة من هاتين الشمعتين. يمكنك الانتظار حتى يصل السعر إلى هذه المستويات للتحكم بالمخاطر. المستويات قابلة للتعيين. الجانب المقابل هو نفسه (ارتفاع أقل وقاع أقل).
- الحد الأدنى لتغير النسبة المئوية: يجب أن تشكل الشمعتان المستخدمتان لمستويات فيبو تغيرًا في السعر أكبر من هذه النسبة.
- مستويات فيبو: ضع مستوياتك مفصولة بفواصل.
- اللون: لون توضيح الشمعة.
الملخص
AI summary
LT_Ind_Candles is a technical indicator designed to detect and annotate common candlestick patterns on trading charts. It identifies single-candle patterns such as Doji, Hammer, and Shooting Star; two-candle patterns including Engulf, DarkCloud, Piercing, and Harami; and three-candle patterns like Morning Stars and Evening Stars. Additionally, it can highlight Marubozu candles based on configurable size criteria using ATR or bar body measurements.
The indicator offers customizable settings to adjust pattern detection sensitivity, including maximum Doji size ratio, Marubozu factor, and options to use bar range or body for calculations. Users can specify which patterns to detect by listing them in the settings. A risk control feature plots Fibonacci retracement levels when two consecutive candles form higher highs and higher lows (or lower highs and lower lows), aiding in entry and exit decisions. These Fibonacci levels and minimum price change thresholds are configurable.
LT_Ind_Candles supports multiple markets such as Forex, indices, commodities, cryptocurrencies, and stocks. It is tested on the cTrader Windows platform. Candle annotations are color-customizable for clarity. This tool assists traders in visually recognizing key candlestick formations and managing risk through Fibonacci retracement guidance.
The indicator offers customizable settings to adjust pattern detection sensitivity, including maximum Doji size ratio, Marubozu factor, and options to use bar range or body for calculations. Users can specify which patterns to detect by listing them in the settings. A risk control feature plots Fibonacci retracement levels when two consecutive candles form higher highs and higher lows (or lower highs and lower lows), aiding in entry and exit decisions. These Fibonacci levels and minimum price change thresholds are configurable.
LT_Ind_Candles supports multiple markets such as Forex, indices, commodities, cryptocurrencies, and stocks. It is tested on the cTrader Windows platform. Candle annotations are color-customizable for clarity. This tool assists traders in visually recognizing key candlestick formations and managing risk through Fibonacci retracement guidance.
ملف تعريف المؤشر
تقييمات العملاء
4.0
التقييمات: 2
5 | 0 % | |
4 | 100 % | |
3 | 0 % | |
2 | 0 % | |
1 | 0 % |
تقييمات العملاء
October 11, 2024
ngl, trade control feels cleaner and that is enough to keep testing it. The danger is trusting it too quickly.
September 28, 2024
مناقشة
الأسئلة الشائعة
Forex
Signal
Indices
Commodities
Crypto
Stocks
ATR
يتم توفير المنتجات المتاحة من خلال cTrader Store، بما في ذلك روبوتات التداول والمؤشرات والإضافات، من قبل مطوري الطرف الثالث وإتاحتها لأغراض الوصول المعلوماتي والفني فقط. cTrader Store ليس وسيطًا ولا يقدم نصائح استثمارية أو توصيات شخصية أو أي ضمان للأداء المستقبلي.

























السعر
منذ 25/09/2024
38
المبيعات