
Descrizione
Nota: Testato solo su cTrader Windows.
LT_Ind_Pivot è un indicatore Pivot Point potente e personalizzabile per cTrader che aiuta a visualizzare i livelli chiave di mercato e le strutture delle sessioni su più timeframe.
Calcola e traccia automaticamente Pivot (P), Supporto (S1–S5), Resistenza (R1–R5), e CPR (TC/BC) basandosi sul timeframe di ancoraggio scelto — da H1, H4, H8, H12, D1, W1, a Month1.
L'indicatore disegna anche linee separatrici verticali per ogni periodo di ancoraggio, sia sul grafico principale che nei pannelli degli indicatori, facilitando la distinzione dei confini di sessione o periodo.
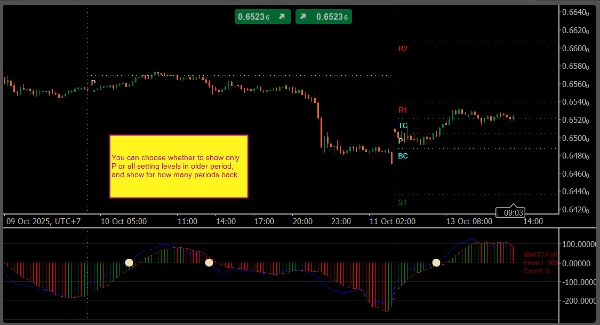
Puoi definire esattamente quali livelli mostrare usando una notazione flessibile come:
P, S1, R1– livelli standardPS1,S1S2,R1R2, ecc. – livelli intermedi tra pivot e supporti/resistenze principaliTC,BC– Central Pivot Range (CPR)
I controlli di visualizzazione ti permettono di impostare quanti pivot storici mantenere visibili, se mostrare etichette di testo/prezzo e come colorare o stilizzare ogni livello.
Caratteristiche principali
- Ancore pivot: H1, H4, H8, H12, D1, W1, Month1
- Sintassi livelli personalizzata:
P, Sx, Rx, PS1, S1S2, R1R2, TC, BC - Separatore periodi verticali su grafico e pannelli indicatori
- Opzione per mostrare testo, prezzi e vecchi livelli pivot
- Personalizzazione completa di colori e stili di linea
- Leggero e adatto al trading live
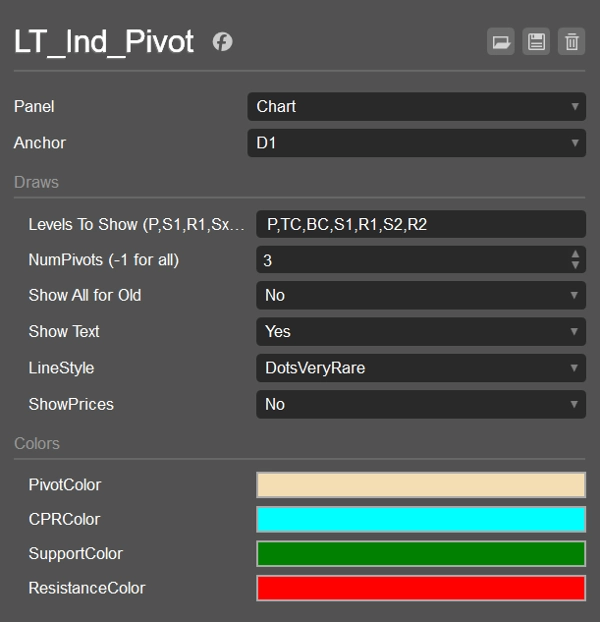
Impostazioni predefinite
- Ancora: D1
- Mostra livelli:
P,S1,R1 - NumPivotsBack: 1
- ShowAllForOldPivots: false
- Mostra testo: true
- Mostra prezzi: false
- Stile linea: Solido
- Colori: Pivot = Wheat, CPR = Cyan, Supporto = Verde, Resistenza = Rosso
Casi d'uso
- Segnare zone di supporto/resistenza intraday e swing
- Monitorare CPR e livelli intermedi per setup di breakout o rientro alla media
- Usare separatore periodi per analizzare la struttura sessione per sessione
- Combinare con indicatori VWAP o Swing per una maggiore confluencia
Riepilogo
Recensioni dei clienti
5 | 0 % | |
4 | 100 % | |
3 | 0 % | |
2 | 0 % | |
1 | 0 % |


