
HTFBB
Indikator
1 pembelian
Versi 1.0, Jul 2025
Windows, Mac
5.0
Ulasan: 1
Penerangan
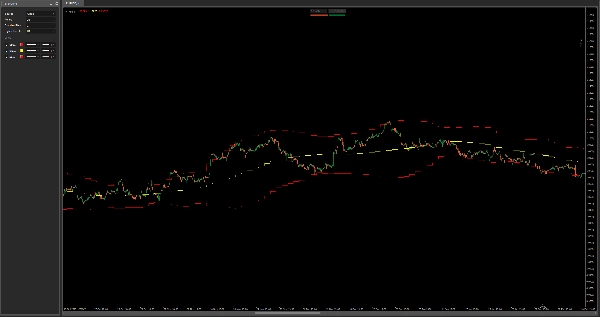
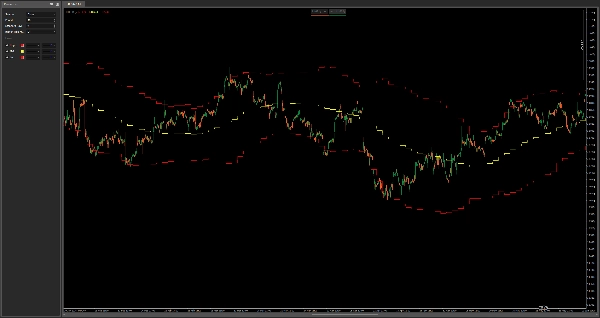
HTF Bollinger Bands – Peta Volatiliti Berbilang Jangka Masa
Penunjuk ini memplot Bollinger Bands dari jangka masa yang lebih tinggi ke carta semasa anda, memberikan anda konteks yang kuat untuk volatiliti, pembalikan purata, dan sokongan/rintangan dinamik—semua tanpa menukar jangka masa.
Ciri-ciri:
- Memaparkan Bollinger Bands atas, tengah, dan bawah dari mana-mana jangka masa yang lebih tinggi yang boleh dipilih
- Sesuai untuk mengenal pasti zon pemadatan HTF, tekanan pecahan, dan tarikan balik tren
- Ideal untuk scalping dan kemasukan intrahari dengan kesedaran jangka masa yang lebih tinggi
- Berfungsi pada semua aset dan jangka masa
Gabungkan dengan strategi semasa anda untuk mengelakkan berdagang ke dalam perangkap volatiliti dan kekal selaras dengan struktur harga makro.
Ringkasan
Profil indikator
Ulasan pelanggan
5.0
Ulasan: 1
5 | 100 % | |
4 | 0 % | |
3 | 0 % | |
2 | 0 % | |
1 | 0 % |
Ulasan pelanggan
July 29, 2025
confusing signals get easier to ignore, but a clean signal can still fail.
Perbincangan
Soalan Lazim
Produk yang tersedia melalui cTrader Store, termasuk bot dagangan, indikator dan plugin, disediakan oleh pembangun pihak ketiga dan diberikan akses untuk tujuan maklumat dan teknikal sahaja. cTrader Store bukan broker dan tidak memberikan nasihat pelaburan, syor peribadi atau sebarang jaminan prestasi masa hadapan.


Harga
Sejak 03/01/2025
638.03K
Volum yang didagangkan
21.34K
Pip dimenangi
15
Jualan