
SwingHighLow
Indikator
10 pembelian
Versi 1.0, Jul 2025
Windows, Mac
4.3
Ulasan: 3
Penerangan
Penunjuk Swing High/Low untuk cTrader
Peta Struktur Pasaran Seperti Profesional.
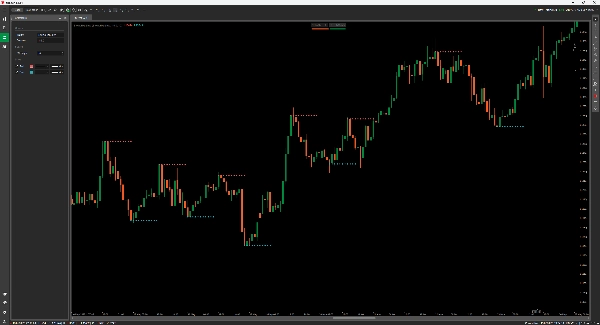
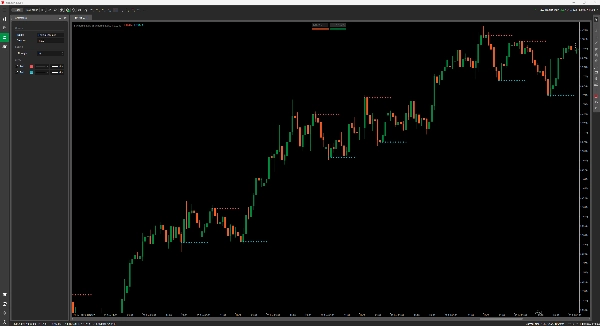
Penunjuk Swing High/Low ini secara automatik mengesan dan melakar titik pusingan penting pada carta anda—sesuai untuk pedagang yang bergantung pada tindakan harga, struktur, dan zon sokongan/rintangan.
Ciri-ciri:
- Menonjolkan swing tinggi yang disahkan (merah) dan swing rendah (biru) dengan plot titik yang jelas.
- Parameter Kekuatan yang boleh disesuaikan membolehkan anda menapis bunyi atau mengetatkan isyarat.
- Sesuai untuk analisis tren, pengesanan pembalikan, dan perangkap pecahan.
Berfungsi pada semua jangka masa. Tiada lukisan semula. Hanya struktur pasaran yang kukuh, ditandakan dengan jelas.
Ringkasan
Ringkasan AI
The SwingHighLow indicator for cTrader automatically detects and plots significant swing highs and lows on price charts, aiding traders in identifying market structure, price reversals, and support/resistance zones. It highlights confirmed swing highs in red and swing lows in blue with clear point markers. The indicator includes an adjustable strength parameter that allows users to filter market noise or tighten signal sensitivity according to their trading preferences. It is suitable for use across all timeframes and supports analysis for various markets including Forex, indices, commodities, stocks, and cryptocurrencies such as BTCUSD, EURUSD, and XAUUSD. The tool is designed to assist with trend analysis, spotting reversals, and identifying breakout traps without repainting, providing consistent and reliable market structure visualization.
Profil indikator
Ulasan pelanggan
4.3
Ulasan: 3
5 | 67 % | |
4 | 0 % | |
3 | 33 % | |
2 | 0 % | |
1 | 0 % |
Ulasan pelanggan
July 22, 2025
Good support for rules for swing point analysis. it helps identify turning points and cleaner structure, especially when used for reviewing reversals, pullbacks and swing zones. Swing points look better after 3 pivots, especially when the 0.5 Fib area agrees with structure. The level is useful when it supports the market story.
July 21, 2025
July 21, 2025
Practical choice for demo for a more controlled workflow. It helps with reviewing reversals, pullbacks and swing zones, but the signal still needs broader context. Swing points look better after 3 pivots, especially when the 0.5 Fib area agrees with structure. I would still keep manual review in the process.
Perbincangan
Soalan Lazim
BTCUSD
Forex
Signal
Breakout
Indices
EURUSD
Supertrend
Commodities
Stocks
XAUUSD
ATR
Produk yang tersedia melalui cTrader Store, termasuk bot dagangan, indikator dan plugin, disediakan oleh pembangun pihak ketiga dan diberikan akses untuk tujuan maklumat dan teknikal sahaja. cTrader Store bukan broker dan tidak memberikan nasihat pelaburan, syor peribadi atau sebarang jaminan prestasi masa hadapan.


Harga
Sejak 03/01/2025
638.03K
Volum yang didagangkan
21.34K
Pip dimenangi
15
Jualan