
Deskripsi
QX Heatmap Scanner adalah panel heatmap ringkas di grafik yang membantu Anda memindai beberapa simbol dan kerangka waktu dalam hitungan detik. Ini merangkum Arah, Kekuatan, dan Volatilitas menjadi skor per-sel yang jelas sehingga Anda dapat memprioritaskan kondisi terbaik dan menghindari pengaturan berkualitas rendah.
Apa yang Anda lihat
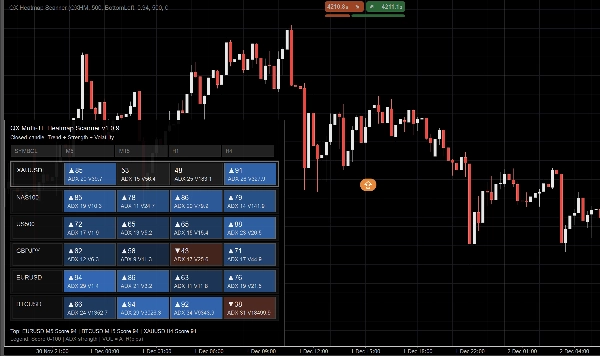
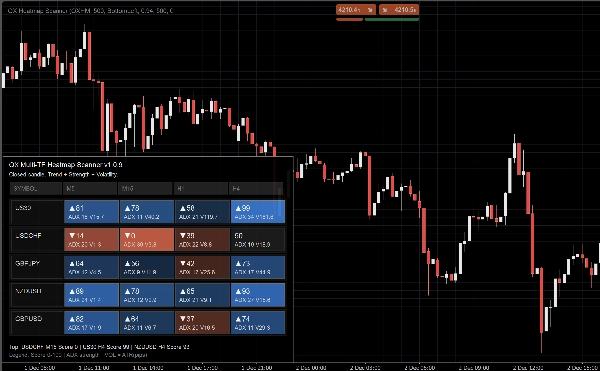
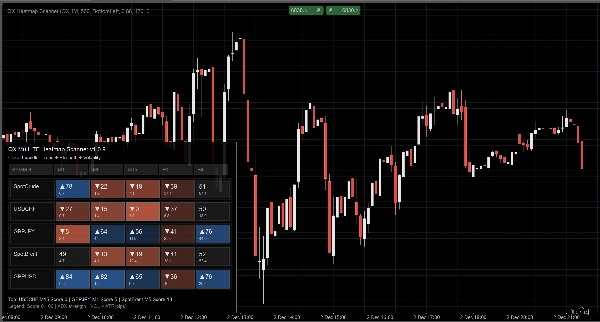
Setiap sel (Simbol × Kerangka Waktu) menampilkan:
- Skor (0–100) dengan penanda arah (▲/▼ saat bias)
- ADX nilai (konteks kekuatan)
- VOL nilai (konteks volatilitas)
Intensitas warna mencerminkan keyakinan. Tata letak tetap terbaca bahkan dengan banyak kerangka waktu.
Mode tampilan
- Otomatis: menyesuaikan dengan lebar sel yang tersedia
- Penuh: detail maksimum
- Kompak: dioptimalkan untuk lebih banyak kerangka waktu sambil menjaga ADX dan VOL tetap terlihat
- Minimal: tata letak sangat rapat untuk layar kecil
Mengapa ini membantu
- Konteks top-down lebih cepat sebelum masuk posisi
- Perbandingan lintas pasar cepat tanpa membuka banyak grafik
- Pengambilan keputusan lebih bersih dengan menyoroti kondisi yang lebih kuat
Performa dan stabilitas
- Dirancang untuk memperbarui pada lilin yang tertutup untuk sinyal yang lebih bersih dan noise lebih rendah
- Throttle Pembaruan (ms) untuk mengontrol penggunaan CPU
- Penanganan defensif untuk simbol yang hilang atau data yang tidak cukup
Fitur utama
- Panel heatmap multi-simbol, multi-kerangka waktu
- Skor 0–100 per sel dengan petunjuk arah yang jelas
- ADX dan VOL ditampilkan secara konsisten
- Sudut panel, lebar, opasitas, dan font yang dapat disesuaikan
- Kustomisasi warna (bull/bear/netral + rentang intensitas)
Parameter utama
Simbol (CSV), Kerangka Waktu (CSV), Kepadatan Tampilan, Lebar/Sudut/Opasitas Panel, Tampilkan VOL, Ukuran Font, Throttle Pembaruan.
Catatan: Alat ini menyediakan konteks pasar. Ini bukan sistem perdagangan otomatis dan tidak menggantikan manajemen risiko.
Ringkasan
The panel supports various display modes—Auto, Full, Compact, and Minimal—allowing customization for different screen sizes and detail preferences. Users can adjust panel position, width, opacity, fonts, and color schemes for bullish, bearish, and neutral conditions.
QX Heatmap Scanner updates on closed candles to reduce noise and includes an update throttle feature to manage CPU usage. It handles missing symbols or insufficient data defensively to maintain stability.
Key features include quick top-down market context, cross-market comparison without multiple charts, and highlighting of stronger trading conditions. It supports symbols such as BTCUSD, EURUSD, GBPUSD, and markets including Forex, Crypto, Stocks, Commodities, and Indices. Parameters like symbols, timeframes, display density, and update throttle are user-configurable.
This tool provides market context to assist decision-making but does not execute trades or replace risk management.
Ulasan pelanggan
5 | 33 % | |
4 | 67 % | |
3 | 0 % | |
2 | 0 % | |
1 | 0 % |


