
QX VolumeProfile Pro
Indikator
Versi 1.0, Jan 2026
Windows, Mac
5.0
Ulasan: 1
Deskripsi
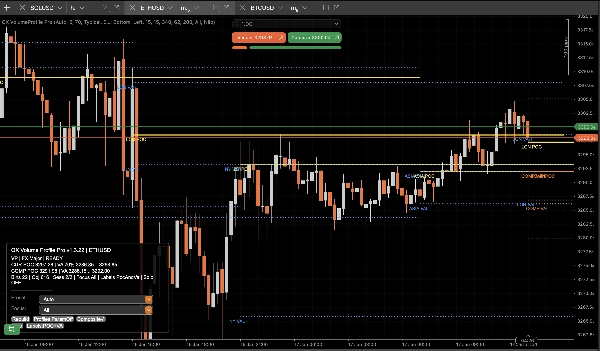
QX Volume Profile Pro adalah Session Volume Profile kelas produksi yang dibangun untuk kondisi perdagangan nyata: cepat, stabil, deterministik, dan bersih di tepi kanan yang keras.
Berhenti menggunakan alat “profile” yang membengkak yang lambat, memenuhi grafik Anda, merusak autoscale, dan meninggalkan objek hantu.
Mengapa QX VP Pro berbeda?
Apa yang salah dari kebanyakan alat, kami hilangkan:
- Tidak ada objek hantu. Nyalakan/matikan Profil/Label tanpa sampah tersisa.
- Tidak ada distorsi grafik. Perilaku overlay sejati yang tidak merusak autoscale harga.
- Performa siap langsung. Berjalan bar-close untuk stabilitas dan kecepatan, bukan kekacauan tick.
- Kebersihan objek + batasan. Mencegah spam objek grafik yang tidak terkendali yang membunuh performa.
- Pembangunan ulang deterministik. Muat ulang, bangun ulang, dan perubahan fokus tetap konsisten dan dapat diprediksi.
Apa yang Anda dapatkan di grafik
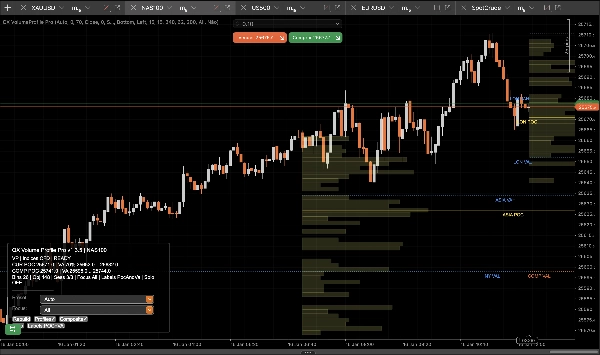
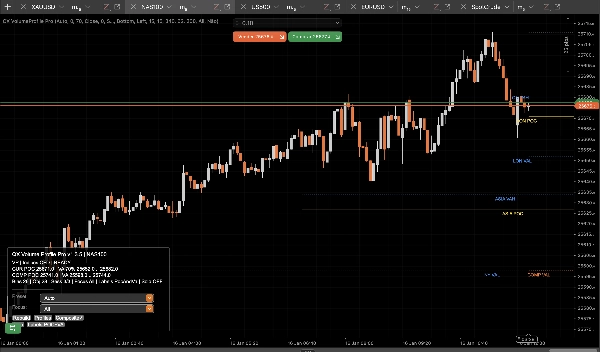
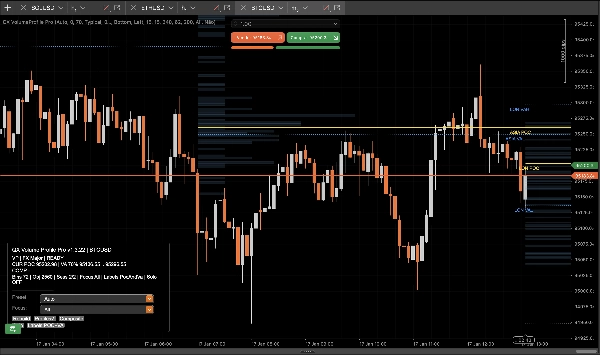
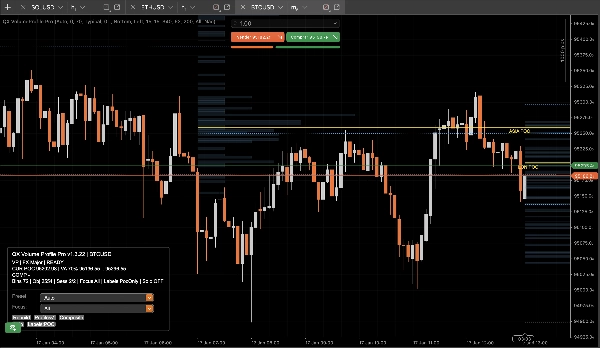
- Profil Sesi (ASIA / LON / NY / C1 / C2) dengan POC / VAH / VAL level yang bersih.
- Profil Komposit (gabungan multi-sesi) untuk zona nilai dominan dan penerimaan pasar “nyata”.
- Level Kunci (Kemarin + Mingguan) untuk konteks dan konfluensi tanpa kekacauan.
- Label Pintar yang mengidentifikasi sesi dan mengurangi tumpang tindih untuk pembacaan tepi kanan yang cepat.
- Filter Sesi Fokus untuk mengisolasi hanya apa yang penting saat ini.
- Mode Solo Komposit untuk tampilan bedah: hanya komposit + level kunci.
Cara Menggunakan (Alur Kerja Perdagangan Praktis)
1) Pilih mode operasi Anda
- Mode Sesi: Gunakan POC/VAH/VAL sesi sebagai level penerimaan dan penolakan intraday.
- Mode Komposit: Gunakan POC/VAH/VAL komposit sebagai jangkar “nilai” dengan kepercayaan lebih tinggi di seluruh sesi.
2) Atur sesuai gaya Anda
- Scalper:
-
- Gunakan XAU Scalper atau FX Major preset
- Nyalakan Label = hanya POC untuk kejelasan maksimal
- Gunakan Fokus = Saat Ini selama eksekusi
- Intraday / Swing:
-
- Gunakan XAU Swing atau Indices CFD preset
- Aktifkan Komposit
- Pertahankan Kemarin/Mingguan MENYALA untuk penyelarasan struktur
3) Interpretasi level (aturan sederhana)
- POC (Point of Control): Harga yang paling diterima oleh volume.
-
- Di atas POC: bias penerimaan bullish
- Di bawah POC: bias penerimaan bearish
- VAH / VAL (Value Area High/Low): “Batas nilai wajar.”
-
- Break + bertahan di luar VA: kelanjutan / perluasan tren
- Penolakan kembali ke dalam VA: mean reversion / setup fade
- VA Komposit: Zona nilai “makro intraday” yang lebih kuat. Gunakan sebagai magnet atau batas.
4) Daftar periksa eksekusi (cepat)
- Identifikasi zona kunci Anda: Session VA atau Composite VA
- Cari reaksi harga: penolakan atau penerimaan
- Gunakan Level Kunci (Kemarin/Mingguan) sebagai konfluensi
- Gunakan Fokus untuk menghilangkan kebisingan dan tetap objektif
- Gunakan Solo Komposit saat Anda hanya menginginkan tampilan sinyal tertinggi
Kontrol (Apa yang dilakukan panel)
- Profil: Tampilkan/sembunyikan histogram secara instan (level tetap bersih dan konsisten).
- Komposit: Nyalakan/matikan level profil gabungan.
- Fokus: Semua / Saat Ini / ASIA / LON / NY / C1 / C2.
- Solo: Hanya Komposit + Level Kunci.
Catatan
- Hanya indikator. Tidak ada perdagangan yang dilakukan.
- Dirancang untuk stabilitas dan performa di grafik langsung.
Ringkasan
Ringkasan AI
QX VolumeProfile Pro is a session-based volume profile indicator designed for real trading conditions, offering fast, stable, and deterministic performance without chart clutter or lag. It provides clean volume profiles for multiple trading sessions (ASIA, LON, NY, C1, C2) with key levels including Point of Control (POC), Value Area High (VAH), and Value Area Low (VAL). The tool supports both session and composite modes, allowing traders to analyze intraday acceptance/rejection levels or multi-session value zones.
Key features include:
- No ghost objects or chart distortion, preserving autoscale integrity.
- Live-ready bar-close updates for stability and speed.
- Object management to prevent performance degradation.
- Smart labels that reduce overlap for clear right-edge reading.
- Focus session filtering to isolate relevant data.
- Composite Solo mode for a simplified view with composite profiles and key levels.
The indicator supports practical workflows for scalpers and intraday/swing traders with presets tailored for instruments like gold (XAU), forex majors, indices, and CFDs. Users can toggle profile visibility, composite levels, focus sessions, and solo mode via an integrated control panel.
QX VolumeProfile Pro is an indicator-only tool, designed to enhance chart analysis by highlighting volume-based market acceptance and rejection zones without executing trades.
Profil indikator
Ulasan pelanggan
5.0
Ulasan: 1
5 | 100 % | |
4 | 0 % | |
3 | 0 % | |
2 | 0 % | |
1 | 0 % |
Ulasan pelanggan
January 27, 2026
Not perfect, but the workflow felt cleaner. It should not replace the chart.
Diskusi
Pertanyaan umum
Signal
Indices
Commodities
GBPUSD
RSI
Bollinger
Fibonacci
Scalping
AI
XAUUSD
NAS100
MACD
BTCUSD
Forex
Breakout
EURUSD
NZDUSD
Prop
ZigZag
Supertrend
Fair Value Gap
SMC
Crypto
Grid
Stocks
ATR
USDJPY
VWAP
Produk-produk yang tersedia melalui cTrader Store, termasuk bot trading, indikator, dan plugin, disediakan oleh pengembang pihak ketiga serta hanya ditujukan untuk akses teknis dan informasi. cTrader Store bukan broker dan tidak menyediakan saran investasi, rekomendasi pribadi, atau jaminan apa pun tentang kinerja di masa mendatang.


![Logo "High-Low Divergence [Iridio Capital]"](https://cdn.ctrader.com/image/webp/443c4661-7abb-40f1-842f-4b6ec560649b_40914)


Harga
41.97M
Volume trading
208.53K
Pip dimenangkan
13
Penjualan
353
Instal gratis