
Mô tả
Chỉ số Áp lực Nến QX là một lớp phủ áp lực nến cho cTrader giúp các nhà giao dịch đọc được mức độ mạnh mẽ khi mỗi cây nến đóng cửa trong phạm vi của nó.
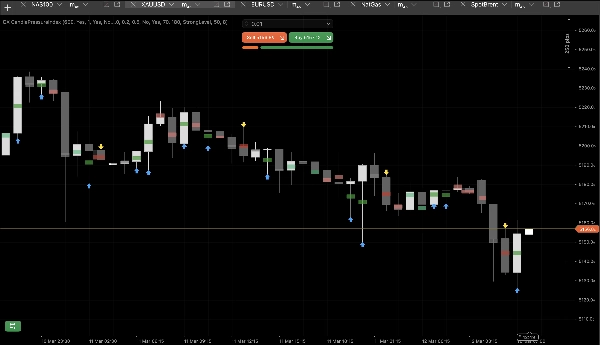
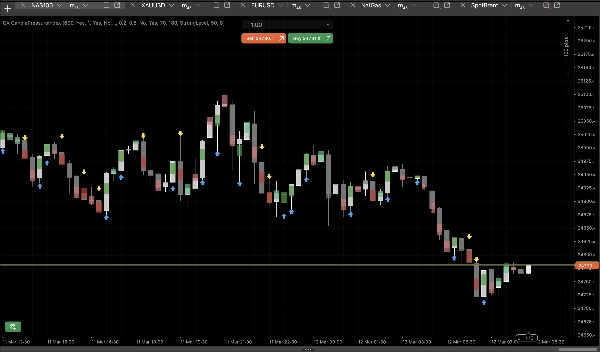
Thay vì sử dụng một cửa sổ dao động riêng biệt, CPI hiển thị áp lực trực tiếp trên biểu đồ chính thông qua các dấu hiệu điểm giữa nhỏ gọn. Điều này giúp dễ dàng đọc độ mạnh đóng cửa, xu hướng tăng hoặc giảm, và động lượng ngắn hạn với ít nhiễu hình ảnh hơn.
Các Ứng Dụng Chính
CPI được thiết kế để giúp các nhà giao dịch:
- đánh giá chất lượng đóng cửa của nến
- xác nhận áp lực theo hướng
- đánh giá sức mạnh phá vỡ
- đọc các đợt hồi rõ ràng hơn
- phát hiện sự thay đổi động lượng sớm hơn
Cách Hoạt Động
Mỗi cây nến được phân loại dựa trên vị trí đóng cửa trong phạm vi của nó:
- gần đỉnh = áp lực tăng
- gần đáy = áp lực giảm
- gần giữa = áp lực trung tính
Thông tin này được hiển thị bằng cách sử dụng:
- các dấu hiệu áp lực điểm giữa
- 5 vùng áp lực
- mũi tên tùy chọn cho áp lực mạnh
- lớp phủ thân nến tùy chọn
Vùng Áp Lực
CPI phân loại nến thành 5 trạng thái hình ảnh:
- Mua Mạnh
- Mua Nhẹ
- Trung Tính
- Bán Nhẹ
- Bán Mạnh
Điều này giúp các nhà giao dịch xác định liệu một chuyển động có mạnh, yếu hay cân bằng.
Các Tính Năng Chính
Dấu Hiệu Áp Lực Điểm Giữa
Các dấu hiệu hình ảnh nhỏ gọn được neo tại điểm giữa của nến.
5 Vùng Áp Lực
Phân tách rõ ràng giữa các đóng cửa mạnh, nhẹ và trung tính.
Bỏ Qua Nến Đang Hình Thành
Bỏ qua nến đang hình thành cho đến khi nó đóng cửa để có các chỉ báo ổn định hơn.
Ẩn Dấu Hiệu Trung Tính
Giữ cho biểu đồ sạch hơn bằng cách chỉ hiển thị các nến có hướng.
Chế Độ Mũi Tên
Làm nổi bật các nến tăng hoặc giảm mạnh một cách trực quan.
Lớp Phủ Thân Nến
Thêm một lớp phụ tinh tế giúp dễ đọc biểu đồ hơn.
Các Tham Số Chính và Cách Sử Dụng
Vẽ Lại Các Nến
Điều khiển số lượng nến quá khứ được hiển thị.
Bỏ Qua Nến Đang Hình Thành
Bật để đọc nến đã đóng và có tín hiệu ổn định hơn.
Ngưỡng Nhẹ
Xác định khi nào một cây nến không còn trung tính.
Ngưỡng Mạnh
Xác định khi nào áp lực trở nên mạnh mẽ.
Ẩn Dấu Hiệu Trung Tính
Sử dụng để có cái nhìn hướng rõ ràng hơn.
Chế Độ Mũi Tên
Chọn giữa không có mũi tên, mũi tên trên mỗi nến mạnh, hoặc mũi tên chỉ trên các chuyển đổi mạnh.
Tỷ Lệ / Độ Rộng / Độ Mờ Của Dấu Hiệu
Điều chỉnh hình thức hiển thị để phù hợp với phong cách biểu đồ của bạn.
Phù Hợp Nhất Cho
- xác nhận tiếp diễn xu hướng
- đánh giá chất lượng phá vỡ
- phân tích hồi giá
- đọc động lượng ngắn hạn
- diễn giải hành động giá sạch hơn
Tóm Tắt
Chỉ số Áp lực Nến QX là một công cụ hình ảnh sạch sẽ dành cho các nhà giao dịch muốn đọc áp lực nến trực tiếp trên biểu đồ, mà không cần thêm một cửa sổ chỉ báo khác.
Tóm tắt
Đánh giá của khách hàng
5 | 50 % | |
4 | 50 % | |
3 | 0 % | |
2 | 0 % | |
1 | 0 % |


