
Deskripsi
Berikut adalah rumus untuk menghitung Pivot Points standar:
PP = (High + Low + Close)/3
S1 = (PP * 2) – High
S2 = PP – (High – Low)
S3 = Low – 2(High – PP)
R1 = (PP * 2) – Low
R2 = PP + (High – Low)
R3 = High + 2(PP – Low)
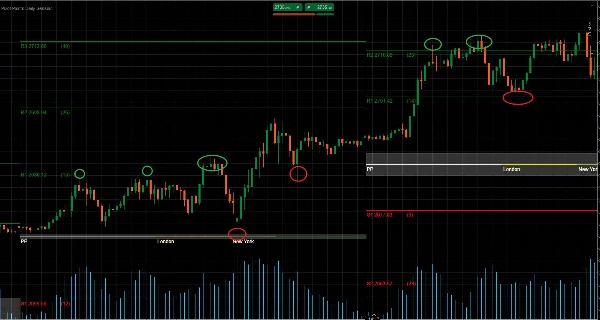
Pivot points dapat digunakan untuk mengidentifikasi tren keseluruhan, karena pergerakan melalui pivot points ke atas menunjukkan tren naik. Sementara sebaliknya, di mana harga terus turun di bawah pivot points selama sesi, menunjukkan tren turun.
Dalam pasar yang bergerak menyamping, trader dapat dengan mudah menjual (short) di resistance dan membeli (long) di support. Misalnya, jika pasar berada di antara R1 dan S1, order beli akan ditempatkan di sekitar S1, dengan order jual ditempatkan di sekitar R1.
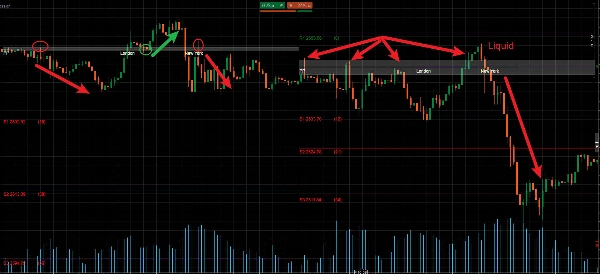
Dalam pasar yang sedang tren, Pivot Points yang relevan akan berfungsi sebagai titik referensi untuk pasar yang melakukan retrace agar melanjutkan tren utama. Misalnya, jika harga berada di atas PP selama tren naik tetapi di bawah R2. Trader dapat mempertimbangkan untuk menempatkan order beli yang menguntungkan di sekitar R1.
Level support dan resistance pasti akan ditembus di beberapa titik dalam pasar. Periode breakout ini dapat menawarkan banyak peluang trading di pasar. Pivot points juga dapat digunakan untuk trading potensi breakout harga di pasar.
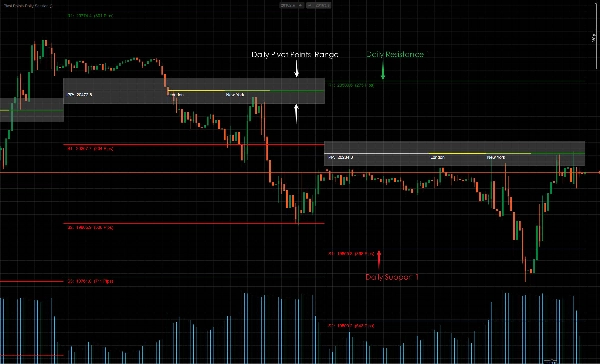
Breakout harga terjadi ketika harga menembus level support atau resistance yang ada dan secara efektif mengubah perannya. Misalnya, jika terjadi breakout ke bawah di S2, garis pivot tidak lagi menjadi garis support dan sekarang dianggap sebagai garis resistance.
Dalam skenario ini, hanya order jual yang akan dipertimbangkan di bawah S2, dan garis pivot lainnya dapat menjadi panduan untuk penempatan stop loss dan take profit. Stop loss untuk order jual dapat ditempatkan di atas S2 dan S1, dengan target profit ditempatkan di S3 dan di bawahnya.
中文说明:
枢轴点可用于识别整体趋势,因为价格向上突破枢轴点表明上升趋势。与此同时,相反的情况,即价格在交易时段内持续跌破枢轴点,则表明下降趋势。
在区间震荡市场中,交易者可以简单地在阻力位做空(卖出)和在支撑位做多(买入)。例如,如果市场在R1和S1之间波动,买单将放置在S1附近,卖单放置在R1附近。
在趋势市场中,相关的枢轴点将作为回调市场恢复主要趋势的参考点。例如,如果在上升趋势中价格高于PP但低于R2,交易者可以考虑在R1附近设置有利可图的买单。
支撑位和阻力位在某些市场情况下必然会被突破。这些突破期可以在市场中提供许多交易机会。枢轴点也可用于交易市场中潜在的价格突破。
价格突破发生在价格冲破现有的支撑位或阻力位并有效转换其角色时。例如,如果在S2处发生向下突破,该枢轴线将不再是支撑线,而将被视为阻力线。
在这种情况下,只有在S2下方才会考虑卖单,其他枢轴线可以指导止损和止盈的设置。卖单的止损可以设在S2和S1上方,盈利目标设在S3及以下。
Ringkasan
Ulasan pelanggan
5 | 100 % | |
4 | 0 % | |
3 | 0 % | |
2 | 0 % | |
1 | 0 % |


![Logo "[Hamster-Coder] Moving Average MTF"](https://cdn.ctrader.com/image/webp/b11b98b1-194d-4b8e-b00e-d611826ad159_31226)


