
Candles_Painter
Indicatore
3 acquisti
Versione 1.0, Aug 2025
Windows, Mac
5.0
Recensioni: 2
Da 26/05/2025
380.55M
Volume negoziato
60.65K
Profitto in pip
14
Vendite
1.38K
Installazioni gratuite
Descrizione
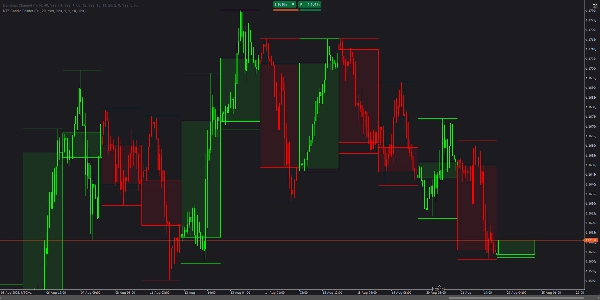
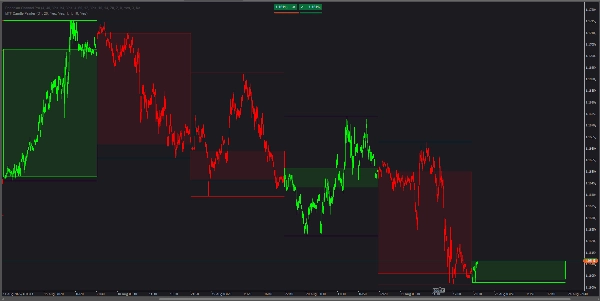
MTF Candle Painter sovrappone il contesto del timeframe superiore (HTF) direttamente sul tuo grafico attuale. Colora ogni barra sul timeframe attivo in base alla direzione della candela HTF che la racchiude e disegna un rettangolo corpo HTF riempito (solo apertura-chiusura, senza stoppini) più linee opzionali HTF High/Low. Colori separati per toro/orso e opacità del riempimento regolabile offrono un bias chiaro e leggibile a colpo d'occhio.
Caratteristiche principali
- Colorazione barre multi-timeframe: tutte le barre all'interno di una candela HTF ereditano il suo colore rialzista/ribassista.
- Sovrapposizione corpo HTF: rettangolo tra apertura e chiusura HTF; nessun stoppino centrale per chiarezza.
- Stile separato toro/orso: colori indipendenti per contorno e riempimento delle candele HTF rialziste e ribassiste.
- Opacità regolabile: imposta la trasparenza del riempimento (default 10%) per un impilamento ordinato con il prezzo.
- Linee HTF High/Low: opzionali, con spessore configurabile.
- Controllo lookback: scegli quante candele HTF recenti visualizzare (default 20).
- Leggero: utilizza oggetti grafici nativi; veloce e discreto.
Parametri
Core
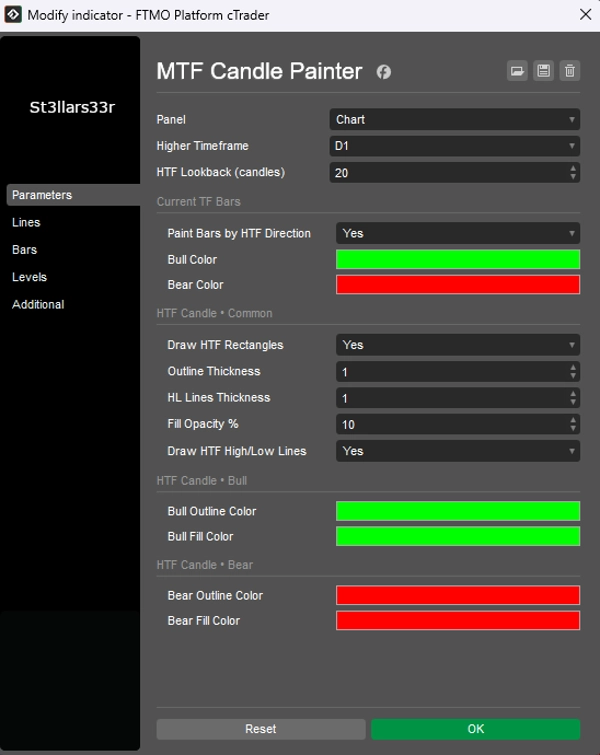
Higher Timeframe– HTF da sovrapporre (es. D1, H4, W1).HTF Lookback (candles)– quante candele HTF disegnare (default 20).
Barre TF Corrente
Paint Bars by HTF Direction– colora le barre del TF corrente in base alla candela HTF che le racchiude (Sì/No).Bull Color/Bear Color– colori per le barre del TF corrente.
Candela HTF • Comune
Draw HTF Rectangles– mostra i rettangoli corpo HTF (default Sì).Outline Thickness– spessore del contorno del corpo HTF.HL Lines Thickness– spessore delle linee HTF High/Low.Fill Opacity %– trasparenza del riempimento del corpo HTF (default 10%).Draw HTF High/Low Lines– attiva/disattiva le linee HTF High/Low (Sì/No).
Candela HTF • Toro
Bull Outline Color– colore del contorno per le candele HTF rialziste.Bull Fill Color– colore del riempimento per le candele HTF rialziste.
Candela HTF • Orso
Bear Outline Color– colore del contorno per le candele HTF ribassiste.Bear Fill Color– colore del riempimento per le candele HTF ribassiste.
A chi è rivolto
- Trader intraday e scalper che necessitano di un bias HTF continuo senza cambiare grafici.
- Praticanti SMC/Wyckoff che si affidano alla struttura del timeframe superiore mentre operano su TF inferiori.
- Chiunque desideri un contesto HTF visivo e pulito sovrapposto al proprio timeframe di lavoro.
Riepilogo
Profilo indicatore
Recensioni dei clienti
5.0
Recensioni: 2
5 | 100 % | |
4 | 0 % | |
3 | 0 % | |
2 | 0 % | |
1 | 0 % |
Recensioni dei clienti
September 1, 2025
The log becomes easier to read, but a manual check is still part of the process.
August 27, 2025
A few ugly trades are useful in the sample, and it makes the setup easier to question.
Discussioni
Domande frequenti
I prodotti disponibili tramite cTrader Store, inclusi bot di trading, indicatori e plugin, sono forniti da sviluppatori terzi e resi disponibili esclusivamente a scopo informativo e di accesso tecnico. cTrader Store non è un broker e non fornisce consulenze in materia di investimento, raccomandazioni individualizzate o garanzie di risultati futuri.


Prezzo
Da 26/05/2025
380.55M
Volume negoziato
60.65K
Profitto in pip
14
Vendite
1.38K
Installazioni gratuite