
Descrizione
Ecco la formula per calcolare i Pivot Point standard:
PP = (High + Low + Close)/3
S1 = (PP * 2) – High
S2 = PP – (High – Low)
S3 = Low – 2(High – PP)
R1 = (PP * 2) – Low
R2 = PP + (High – Low)
R3 = High + 2(PP – Low)
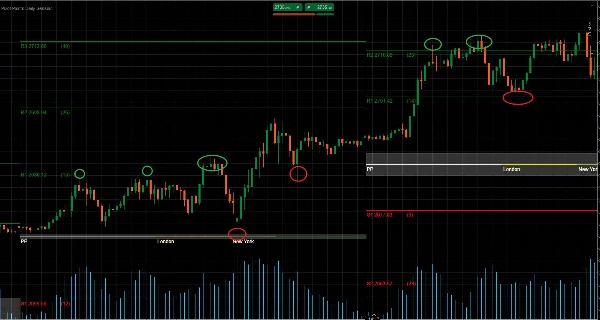
I pivot point possono essere utilizzati per identificare la tendenza generale, poiché un movimento attraverso i pivot point verso l'alto indica un trend rialzista. Nel frattempo, l'opposto, dove il prezzo continua a scendere al di sotto dei pivot point durante una sessione, è indicativo di un trend ribassista.
In un mercato laterale, i trader possono semplicemente vendere (andare short) alla resistenza e comprare (andare long) al supporto. Ad esempio, se il mercato è contenuto tra R1 e S1, gli ordini di acquisto saranno piazzati intorno a S1, con ordini di vendita piazzati intorno a R1.
In un mercato in trend, i Pivot Point rilevanti agiranno come punti di riferimento per i mercati in ritracciamento per riprendere il trend principale. Ad esempio, se i prezzi sono sopra PP durante un trend rialzista ma sotto R2, i trader possono cercare di piazzare ordini di acquisto redditizi intorno a R1.
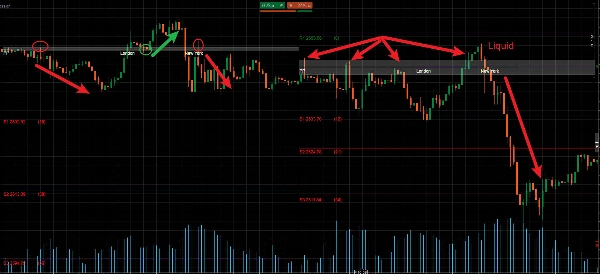
I livelli di supporto e resistenza sono destinati a essere infranti in alcuni momenti del mercato. Questi periodi di breakout possono offrire molte opportunità di trading nel mercato. I pivot point possono anche essere utilizzati per negoziare potenziali breakout di prezzo nel mercato.
I breakout di prezzo si verificano quando il prezzo supera un livello di supporto o resistenza esistente e ne inverte efficacemente il ruolo. Ad esempio, se si verifica un breakout al ribasso a S2, la linea pivot cesserà di essere una linea di supporto e sarà ora considerata una linea di resistenza.
In questo scenario, saranno considerati solo ordini di vendita sotto S2, e altre linee pivot possono guidare il posizionamento di stop loss e take profit. Gli stop loss per gli ordini di vendita possono essere piazzati sopra S2 e S1, con obiettivi di profitto posti a S3 e sotto.
中文说明:
枢轴点可用于识别整体趋势,因为价格向上突破枢轴点表明上升趋势。与此同时,相反的情况,即价格在交易时段内持续跌破枢轴点,则表明下降趋势。
在区间震荡市场中,交易者可以简单地在阻力位做空(卖出)和在支撑位做多(买入)。例如,如果市场在R1和S1之间波动,买单将放置在S1附近,卖单放置在R1附近。
在趋势市场中,相关的枢轴点将作为回调市场恢复主要趋势的参考点。例如,如果在上升趋势中价格高于PP但低于R2,交易者可以考虑在R1附近设置有利可图的买单。
支撑位和阻力位在某些市场情况下必然会被突破。这些突破期可以在市场中提供许多交易机会。枢轴点也可用于交易市场中潜在的价格突破。
价格突破发生在价格冲破现有的支撑位或阻力位并有效转换其角色时。例如,如果在S2处发生向下突破,该枢轴线将不再是支撑线,而将被视为阻力线。
在这种情况下,只有在S2下方才会考虑卖单,其他枢轴线可以指导止损和止盈的设置。卖单的止损可以设在S2和S1上方,盈利目标设在S3及以下。
Riepilogo
Recensioni dei clienti
5 | 100 % | |
4 | 0 % | |
3 | 0 % | |
2 | 0 % | |
1 | 0 % |


