
Descrizione
Questo ALGORITMO è uno strumento tecnico avanzato 🔧 progettato per automatizzare il rilevamento di schemi di prezzo geometrici (Pattern Armonici) e strutture di mercato basate su price action. Il suo obiettivo principale è identificare zone potenziali di inversione di tendenza ad alta probabilità 📍.
https://chartshots.spotware.com/c/693330cd99c57
Cosa fa questo algoritmo?
L'algoritmo scansiona il grafico in tempo reale 🔍 cercando specifiche formazioni di prezzo. Opera su due livelli:
- Mappatura della Struttura (ZigZag): Prima, semplifica il rumore di mercato tracciando linee "ZigZag" che collegano massimi e minimi rilevanti (pivot). Utilizza fino a 4 lunghezze diverse simultaneamente 📏 per catturare sia trend piccoli (a breve termine) che grandi (a lungo termine).
- Riconoscimento dei Pattern: Una volta identificati questi punti pivot (punti A, B, C, D, X), l'algoritmo misura le distanze e i rapporti tra di essi. Se questi rapporti corrispondono alle regole matematiche dei pattern di trading classici (come Fibonacci), l'indicatore disegna il pattern e avvisa l'utente 🚨.
A cosa serve?
Serve a eliminare la soggettività quando si tracciano pattern complessi e risparmiare tempo nell'analisi ⏳. Invece di misurare manualmente ogni ritracciamento ed estensione di Fibonacci, l'indicatore lo fa automaticamente per:
- Individuare Inversioni: Trovare punti in cui il prezzo potrebbe girare (da rialzista a ribassista o viceversa). 🔄
- Identificare Punti di Entrata: Segnalare zone precise (la "Zona Potenziale di Inversione") per entrare nel mercato. 🎯
- Confermare l'Analisi: Servire come confluenza aggiuntiva alla tua strategia di supporto/resistenza.
Logica dietro i calcoli
Il nucleo dell'indicatore si basa su Rapporti di Fibonacci e simmetria di mercato ⚖️. L'algoritmo verifica regole rigorose per ogni pattern. Per esempio, per confermare un "Gartley" pattern, l'algoritmo calcola internamente:
- Se il ritracciamento del punto B rispetto alla gamba XA è esattamente (o molto vicino a) 0.618.
- Se la proiezione del punto D rispetta proporzioni specifiche.
L'indicatore consente un piccolo margine di errore (configurabile) perché il mercato raramente è perfetto al pip esatto. Calcola anche il teorico rapporto rischio/ricompensa prima di mostrare un pattern.
Pattern che rileva:
https://chartshots.spotware.com/c/6933314cb9fa1
- Classici: Doppio Massimo e Doppio Minimo. 🏔️🏞️
- Armonici: Gartley, Bat 🦇, Butterfly 🦋, Crab 🦀, Deep Crab, Shark 🦈, Cypher.
- Strutture ABCD: ABCD classico, AB=CD, ABCD esteso.
- Esotici: Three Drives, 5-0.
https://chartshots.spotware.com/c/6933317ae4324
Come usarlo?
Configurazione Visiva:
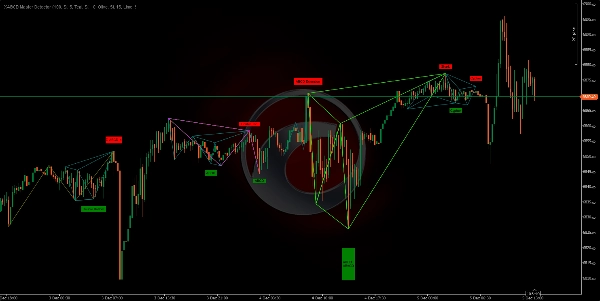
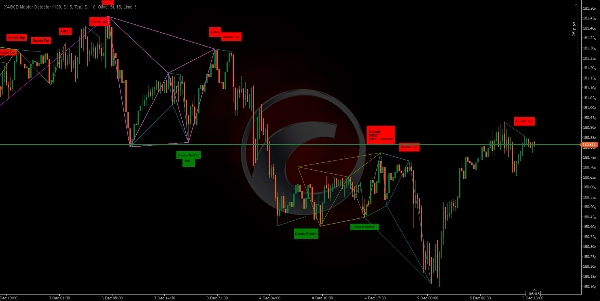
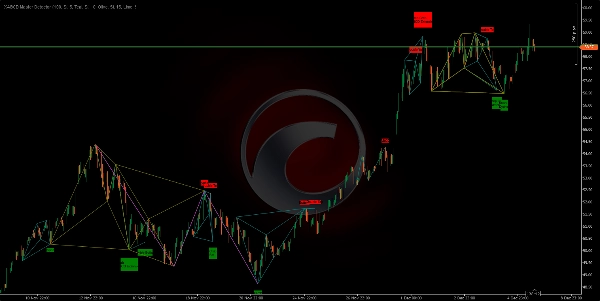
- Vedrai linee colorate che collegano picchi e valli.
- Quando un pattern è completo, apparirà una figura geometrica colorata e un etichetta con il nome del pattern (es. "Gartley", "Doppio Massimo").
- Etichette Verdi: Indicano pattern rialzisti (cerca acquisti). 📈
- Etichette Rosse: Indicano pattern ribassisti (cerca vendite). 📉
Interpretazione:
- Non fare trading su ogni etichetta ciecamente. Usalo come segnale di allerta.
- Quando appare un pattern, aspetta che il prezzo reagisca nella zona D (l'ultimo punto del pattern).
- Cerca conferme aggiuntive (come una candela giapponese di inversione o una divergenza RSI) prima di entrare.
Regolazioni Chiave:
- Puoi attivare o disattivare pattern specifici se vuoi fare trading solo su alcuni (es. solo "Bat" e "Gartley"). ✅
- Puoi regolare la sensibilità degli ZigZag per vedere movimenti più veloci o trend più lenti. ⚙️
🏆 Oltre 10.000 trader si affidano alla nostra suite di oltre 25 algoritmi! 🏆
Da Struttura di Mercato & Liquidità a Sistemi di Uscita Intelligenti & Strumenti Predittivi - abbiamo costruito OGNI strumento di cui hai bisogno per la coerenza.
👉 Accedi a tutti i 25+ sistemi PROVATI:
_______________________________________________
📌 Indicatori di Struttura di Mercato
· ✅ AdvancedMarket Structure: Bos, Choch, SwinLevels, Order Blocks, Market Structure& Liquidity Finder
· 🔄 Dynamic Market StructureAnalysis of Turning Points
· 🧱 Order Block
· ⚖️ Market Imbalance
· ⛓️ BOS & CHOCH
· 🧠 ICT Power of 3
_______________________________________________
🔚 Sistemi di Uscita Intelligenti
_______________________________________________
📐 Indicatori ZigZag
· 🔍 ZigZag Price LiquidityProjection
· ➖ ZigZag
_______________________________________________
🧱 Indicatori di Supporto & Resistenza
· 🟩 SmartTrend Support &Resistance Lines
· 🧱 All Support and ResistanceLevels
_______________________________________________
📊 Indicatori di Trend & Canale
· 📊 Supertrend
_______________________________________________
💧 Strumenti di Volume & Liquidità
_______________________________________________
⚡ Indicatori di Momentum & RSI
· 🔎 Multi-Level Candle Bias
Tracker
_______________________________________________
🔮 Strumenti di Predizione & Proiezione
· 📐 Predizione basata su Linreg& ATR
· 📏 Regressione Lineare FibonacciMulti-timeframe
· 📈 Proiettore di Flusso di Mercato Alimentato dal Volume_________________________
_________________________________________________________________________________________________
_________________________________________________________________________________________________
RSI CHANNEL TRIGGER: 📶
Cos'è: Un indicatore che calcola l'RSI(periodo) e segna visivamente le zone di momentum quando l'RSI attraversa le soglie di ipercomprato/ipervenduto (default 70/30). ✅
https://chartshots.spotware.com/c/69278f8b6d973
Logica: Quando una soglia viene superata, crea una "zona" basata sul massimo/minimo della candela al momento del crossover. Poi: 🧠
- Colore le candele all'interno di quella zona.
- Disegna un canale (alto, basso, medio).
- Segna il crossover nel pannello RSI con un cerchio e un'etichetta.
La zona dura esattamente MinZoneDuration barre. ⏱️
Segnali chiari:
- Crossover sopra Ipercomprato → inizia una zona rialzista. 🟢
- Crossover sotto Ipervenduto → inizia una zona ribassista. 🔴
La zona stessa è un area di interesse, non un ordine.
https://chartshots.spotware.com/c/69278fb274e0b
Come usarlo (rapido):
- Aspetta che la zona si formi. 🎯
- Conferma con price action (breakout/rifiuto dalle linee del canale).
- Entra con uno stop loss fuori dalla zona e un target sulla linea mediana del canale o a un rapporto rischio/ricompensa definito.
https://chartshots.spotware.com/c/69278fe76237b
Parametri Chiave: ⚙️
- Periodo RSI (14)
- Ipercomprato (70)
- Ipervenduto (30)
- MinZoneDuration (15)
- Colori configurabili 🎨
Riepilogo
The algorithm recognizes classic and complex patterns—including Double Top/Bottom, Gartley, Bat, Butterfly, Crab, Deep Crab, Shark, Cypher, ABCD structures, and exotic patterns like Three Drives and 5-0—by measuring distances and Fibonacci ratios between pivot points. Upon pattern completion, it visually displays colored geometric figures and labels indicating bullish (green) or bearish (red) signals.
Users can customize pattern detection and ZigZag sensitivity to suit their trading preferences. The indicator supports various markets such as Forex, commodities, indices, stocks, and cryptocurrencies, including symbols like EURUSD, GBPUSD, BTCUSD, XAUUSD, NAS100, and USDJPY.
XABCD Master Detector aims to reduce subjectivity and save analysis time by automatically calculating Fibonacci retracements, extensions, and theoretical risk/reward ratios. It serves as an alert tool to detect reversals, identify entry points, and provide additional confluence to existing support/resistance strategies.
Recensioni dei clienti
5 | 100 % | |
4 | 0 % | |
3 | 0 % | |
2 | 0 % | |
1 | 0 % |


![Logo di "[Stellar Strategies] BOS Trend 1.0"](https://cdn.ctrader.com/image/webp/6cdec0f1-0e97-4a82-a8a4-2b67aed54d38_25695)


