Descrizione
Indicator del Pinescriptlabs Store: cBot del Pinescriptlabs Store : (cBot) Gold & BTC BreakoutSession Pivots(nuovo)
PRICE ACTION (Nuovo)
Prediction Based on Linreg & ATR
SmartTrend Support &
Resistance
Lines
Dynamic
Market Structure
Analysis
of
Turning
Points
Fibonacci
Linear
Regression
Multi-timeframe
Multi-Level
Candle Bias
Tracker
Auto
Support and
Resistance
Trend
Lines
All
Support and
Resistance
Levels
Fair Value Gap Sessions 📊💰
L'indicatore Fair Value Gap (FVG) è uno strumento di trading sofisticato progettato per identificare e evidenziare inefficienze temporanee del mercato note come "gap di valore equo" 🚨 all'interno di specifiche sessioni di trading. Questi gap rappresentano momenti in cui il prezzo di mercato si muove rapidamente ⚡, creando uno squilibrio tra acquirenti e venditori.
Meccanismi Tecnici Chiave 🔧
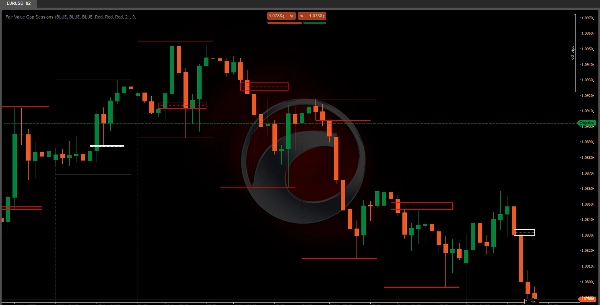
Architettura Basata sulla Sessione 🕒
• Implementa un approccio di analisi preciso e configurabile basato sulla sessione
• Permette ai trader di definire orari di inizio sessione personalizzati con supporto per fuso orario UTC o locale 🌍
• Crea un confine dinamico della sessione che si resetta e traccia il comportamento del mercato 🔄
Logica di Rilevamento del Fair Value Gap 🔎
• Utilizza un'analisi avanzata dell'azione del prezzo su più barre di prezzo consecutive
• Identifica i gap confrontando:
o Prezzi massimi e minimi delle barre consecutive 📈📉
o Prezzo di chiusura della barra precedente ✅
o Struttura del prezzo della barra corrente 🔄
Classificazione dei Gap 🏷️
L'indicatore distingue tra due tipi principali di gap:
- Fair Value Gap Rialzista 📈
o Si verifica quando il prezzo supera il massimo precedente 🔺
o Indica un potenziale slancio rialzista del mercato 🚀
o Segnala una possibile pressione all'acquisto 💸 - Fair Value Gap Ribassista 📉
o Si verifica quando il prezzo scende sotto il minimo precedente 🔻
o Suggerisce un potenziale slancio ribassista del mercato ⬇️
o Segnala una possibile pressione alla vendita 🛑
Applicazioni di Trading 📱💼
Approfondimenti Strategici 💡
• Aiuta i trader a visualizzare le inefficienze del mercato 🖼️
• Fornisce un avviso precoce di potenziali inversioni di tendenza ⚠️
• Offre un'identificazione precisa dei punti di ingresso e uscita 🎯
Caratteristiche di Gestione del Rischio 🛡️
• Visualizzazione codificata a colori degli stati del gap 🎨
• Traccia la "mitigazione" del gap (quando il prezzo ritorna nella zona del gap) ↔️
• Permette impostazioni di colore personalizzabili per diverse condizioni di mercato 🎨
Visualizzazione Tecnica 🎨
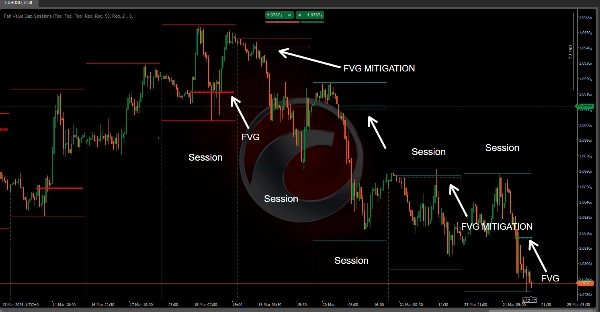
L'indicatore crea due elementi visivi principali:
- Rettangolo dell'Area Gap 🟩
o Rappresenta l'intervallo di prezzo del gap identificato 📐
o Si estende dinamicamente durante tutta la sessione di trading ➡️
o Cambia colore in base allo stato del gap (attivo/mitigato) 🟩➡️🟨 - Linea di Livello 📏
o Posizionata al punto medio del gap ⚫
o Aiuta i trader a identificare rapidamente la zona centrale del prezzo del gap 📍
o Usa stili di linea diversi per indicare lo stato del gap ➔
Strategie di Trading Pratiche 📝
Strategie di Segnale di Ingresso 🚦
• Usa il rilevamento del gap come potenziale segnale di continuazione del trend 🔄
• Cerca il ritorno del prezzo al gap (mitigazione) come conferma ✅
• Combina con altri indicatori tecnici per decisioni robuste 🤝
Tecniche di Gestione del Rischio 🛡️
• Imposta stop-loss vicino ai confini del gap ⛔
• Usa il punto medio del gap come potenziale livello di supporto/resistenza 🪜
• Monitora la mitigazione del gap come potenziale indicatore di inversione di trend ↔️⚠️
Flessibilità di Configurazione ⚙️
• Ora di inizio sessione personalizzabile ⏰
• Configurazione del fuso orario (UTC/Locale) 🌍
Comprendendo e implementando correttamente l'indicatore Fair Value Gap Sessions, i trader possono ottenere approfondimenti più profondi sulle dinamiche di mercato, identificare potenziali opportunità di trading e prendere decisioni più informate basate sulle inefficienze dell'azione del prezzo. 🧠📈
Riepilogo
It classifies gaps into two types: bullish gaps, indicating potential upward momentum and buying pressure, and bearish gaps, signaling possible downward momentum and selling pressure. Visually, it represents gaps with dynamic rectangles showing the price range and a midpoint level line to help traders quickly locate the gap's central price zone. Colors and line styles change to reflect the gap's active or mitigated status.
Traders can use this tool to visualize market inefficiencies, receive early warnings of trend reversals, and identify precise entry and exit points. Risk management features include color-coded gap states, tracking of gap mitigation when price returns to the gap zone, and customizable color settings. The indicator supports practical strategies such as using gap detection for trend continuation signals and combining it with other indicators for decision-making. Stop-loss placement near gap boundaries and monitoring gap mitigation for trend reversal are also supported.
Recensioni dei clienti
5 | 100 % | |
4 | 0 % | |
3 | 0 % | |
2 | 0 % | |
1 | 0 % |


![Logo di "[Hamster-Coder] Pivot Points MTF"](https://cdn.ctrader.com/image/webp/4c143e5a-309c-40e3-a578-f04d1e133ffa_31159)