
Descrizione
Il problema: Sovraccarico di informazioni
La maggior parte dei trader fallisce perché i loro grafici sono ingombri di indicatori ritardati e troppe linee. Perdono di vista la cosa più importante: la Struttura del Mercato.
La soluzione: Struttura del Bias di Trend
Questo indicatore è una potenza "Due in Uno" per la piattaforma cTrader. Combina un Rilevamento Swing di livello professionale con un Motore di Valutazione oggettivo che ti dice esattamente chi controlla il mercato.
Caratteristiche principali:
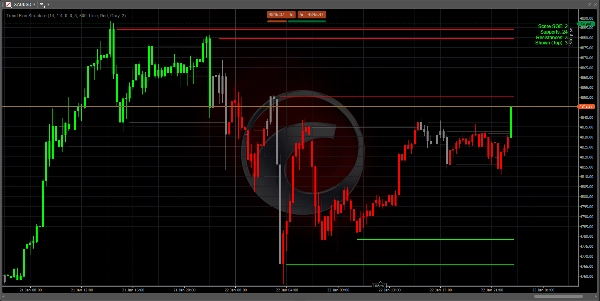
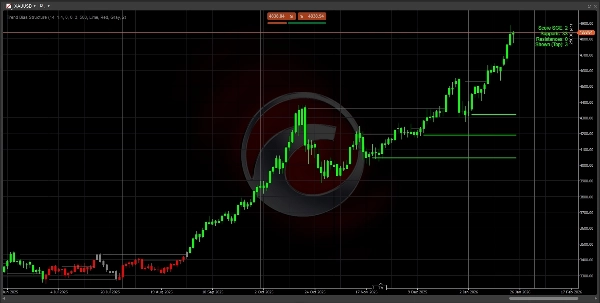
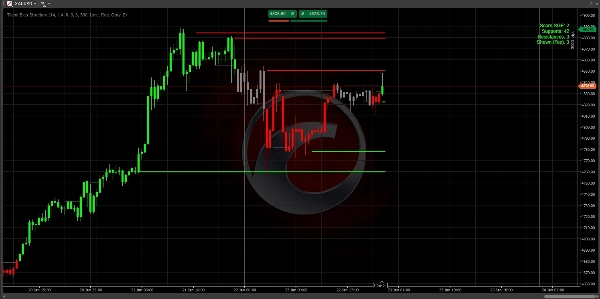
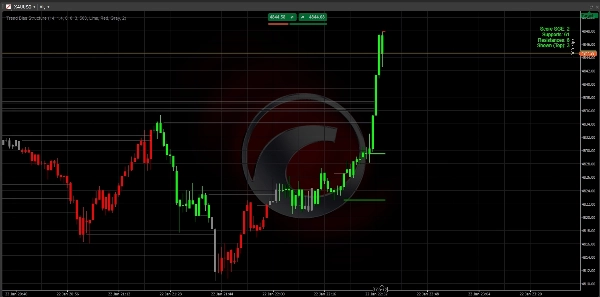
- Mappatura Intelligente della Struttura: Identifica automaticamente livelli significativi di Supporto e Resistenza usando la volatilità filtrata dall'ATR.
- Il Motore di Valutazione SGE: Un sistema di valutazione unico (-2, 0, +2) che calcola la forza del trend basandosi su quanti livelli strutturali sono stati violati.
- Tecnologia Anti-Ingombrante: Mostra solo i 3 livelli più vicini e rilevanti al prezzo attuale. Il tuo grafico rimane pulito, professionale e operativo.
- Rilevamento del Momentum: Usa la logica della "Candela Grande" per assicurarti di operare solo su movimenti con reale supporto istituzionale.
- Completamente Personalizzabile: Adatta la sensibilità al tuo specifico asset (XAUUSD, Forex o Indici).
Come fare trading con esso:
- Controlla il punteggio: Cerca +2 (rialzista) o -2 (ribassista).
- Aspetta il ritracciamento: Lascia che il prezzo torni a una delle Linee di Struttura tracciate.
- Esegui: Opera con il bias, usando i livelli come ancore per entrata/uscita.
Specifiche tecniche
- Piattaforma: cTrader
- Linguaggio: C# (.NET)
- Timeframe: Funziona su tutti i timeframe (M1 a Mensile).
- Asset: Ottimizzato per coppie ad alta liquidità (XAUUSD, EURUSD, GBPUSD).
Nota: Impostazioni iniziali: Per la maggior parte delle coppie principali, le impostazioni predefinite sono ottimizzate. Se stai operando su indici volatili, potresti voler aumentare il Range Global ATR Mult a 2.0
Importante: Come leggere il cruscotto
Il cruscotto nell'angolo in alto a destra è il tuo centro di comando:
- Punteggio +2 (Verde): Forte rialzista. Cerca solo setup di Acquisto.
- Punteggio -2 (Rosso): Forte ribassista. Cerca solo setup di Vendita.
- Punteggio 0 (Grigio): Neutrale. Il mercato è laterale o in transizione. Sii paziente.
- Supporti/Resistenze: Mostra quanti "pavimenti" e "soffitti" storici esistono nel trend attuale.
Strategia di ingresso in 3 passaggi
Passo 1: Identifica il Bias Aspetta che i colori delle candele e il punteggio del cruscotto raggiungano +2 o -2. Questo conferma che il mercato ha rotto la struttura e sta iniziando un trend.
Passo 2: L'area di valore Non inseguire il prezzo. Aspetta che il prezzo ritracci verso una delle 3 linee più vicine tracciate sul tuo grafico.
- In un trend ribassista (Punteggio -2), aspetta che il prezzo tocchi una Linea Rossa.
- In un trend rialzista (Punteggio +2), aspetta che il prezzo tocchi una Linea Verde.
Passo 3: Esecuzione Entra nel trade quando il prezzo tocca la linea e mostra un rifiuto (la formazione di uno stoppino).
- Stop Loss: Posiziona lo SL appena dietro la linea strutturale.
- Take Profit: Punta alla linea strutturale successiva nella direzione del trend.
Consigli professionali per il successo
- Regola dei timeframe più alti: Un punteggio di +2 sul grafico H4 o D1 è molto più potente di un punteggio sul grafico M5. Usa il timeframe più alto per trovare il bias e quello più basso per trovare l'entrata.
- Grafici puliti: Se lo schermo sembra affollato, vai nelle impostazioni e cambia
Max Levels to Showa 2. Questo ti mostrerà solo il "Pavimento" e il "Soffitto" più critici. - La zona "Zero": Quando il punteggio è 0, il mercato sta "ricalcolando". Questo è il momento migliore per prendere profitti da trade precedenti e aspettare una nuova rottura.
Risoluzione dei problemi
- Nessuna linea visibile? Controlla se hai abbastanza storico caricato sul grafico. L'indicatore necessita di almeno 100-200 barre per calcolare ATR e livelli Swing.
- Ritardo dell'indicatore? Se il tuo PC è lento, riduci l'impostazione
Max Historical Linesa 200 per liberare la memoria più velocemente.
Domande frequenti (FAQ)
D: Questo indicatore ridipinge?
R: No. I livelli e i punteggi sono calcolati basandosi su chiusure di candele confermate. Una volta che un livello è rotto o un punteggio cambia alla chiusura di una candela, viene bloccato nella storia.
D: Qual è il timeframe migliore?
R: La logica è universale. Tuttavia, la maggior parte dei trader professionisti lo usa su grafici H1, H4 o Daily per identificare la "Struttura Istituzionale". Se fai scalp su M1 o M5, aspettati cambi di punteggio più frequenti.
D: Posso usarlo con altri indicatori?
R: Sì! Funziona perfettamente come "Filtro Direzionale". Per esempio, prendi segnali RSI di ipervenduto solo se il Punteggio del Bias di Trend è +2.
Buon trading!
Nessun consiglio finanziario. L'indicatore Trend Bias Structure è uno strumento di analisi tecnica progettato per aiutare i trader a identificare la struttura del mercato e il bias di trend.
Riepilogo
Key features include:
- Smart Structure Mapping: Automatically detects significant support and resistance levels filtered by ATR-based volatility.
- SGE Scoring Engine: Calculates trend strength by counting breached structural levels.
- Anti-Clutter Display: Shows only the three closest relevant levels to maintain chart clarity.
- Momentum Detection: Uses "Big Candle" logic to highlight moves with institutional backing.
- Customizable sensitivity for different assets such as XAUUSD, EURUSD, GBPUSD, and indices.
The indicator works on all timeframes from 1 minute to monthly, with professional traders typically using H1, H4, or daily charts to identify institutional structure. The dashboard provides a clear bias score and structural levels to guide trade entries and exits. Users are advised to trade with the bias, waiting for price pullbacks to the nearest structure lines before executing trades.
This tool is intended as a directional filter and can be combined with other indicators like RSI. It does not repaint, as calculations are based on confirmed candle closes.
Recensioni dei clienti
5 | 100 % | |
4 | 0 % | |
3 | 0 % | |
2 | 0 % | |
1 | 0 % |


