
คำอธิบาย
จุดหยุดตามหลังที่ปรับตามความผันผวนซึ่งปรับโดยอัตโนมัติตามสภาพตลาด
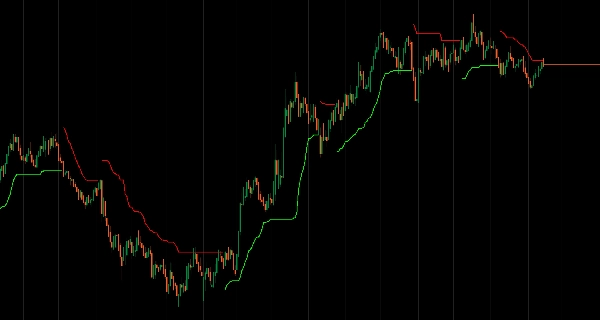
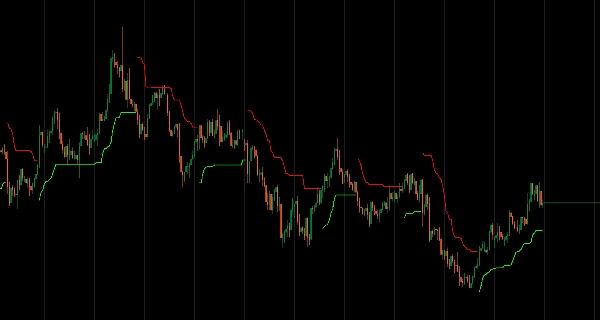
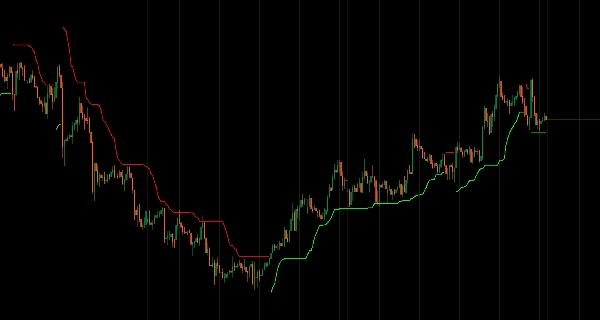
ขยายความกว้างของเส้นตามหลังในช่วงที่ความผันผวนสูงและกระชับในตลาดที่สงบโดยใช้การวัดตาม ATR ป้องกันการออกก่อนเวลาในตลาดที่มีแนวโน้มในขณะที่รักษาความใกล้ชิดในช่วงการรวมตัว
การปรับตัวตามความผันผวนอย่างชาญฉลาดด้วยการคำนวณใหม่แบบเรียลไทม์ การตรวจจับสภาพตลาดด้วยตรรกะยืนยันเพื่อกรองสัญญาณเท็จ ความทรงจำแนวโน้มที่รวมแรงโมเมนตัมทิศทางเพื่อให้มีพื้นที่หายใจในช่วงการเคลื่อนไหวที่แข็งแกร่ง ส่วนประกอบปรับตัวสามอย่าง (Volatility Stretch, Trend Boost, Regime Confirmation) ประเภท MA และพารามิเตอร์ความไวที่ปรับแต่งได้ และการแสดงผลภาพเส้นตามหลังเดียวที่ชัดเจน มอบการจัดการจุดหยุดที่มีความยืดหยุ่นสำหรับผู้ค้าเป้าหมายแนวโน้มที่ยั่งยืนด้วยความตระหนักในโครงสร้าง
คุณสมบัติ
การปรับตัวตามความผันผวนอย่างชาญฉลาด
- ปรับความกว้างของเส้นตามหลังโดยอัตโนมัติด้วยการวัดความผันผวนตาม ATR
- ขยายเส้นตามหลังเมื่อความผันผวนปัจจุบันเกินค่าเฉลี่ย
- กระชับในตลาดที่สงบเพื่อจุดหยุดที่ใกล้ขึ้น
- ปรับตัวแบบเรียลไทม์ตามสภาพตลาดที่เปลี่ยนแปลง
การตรวจจับสภาพตลาด
- ระบุแนวโน้มกระทิง/หมีด้วยตรรกะยืนยัน
- กรองสัญญาณเท็จและลดการแกว่งตัว
- ต้องการแท่งที่ระบุเพื่อยืนยันการเปลี่ยนแนวโน้ม
- การระบุแนวโน้มที่ชัดเจนโดยไม่มีเสียงรบกวน
ความทรงจำแนวโน้ม
- รวมแรงโมเมนตัมทิศทางเพื่อขยายเส้นตามหลังในช่วงแนวโน้มที่แข็งแกร่ง
- เพิ่มพื้นที่หายใจในช่วงการเคลื่อนไหวทิศทางที่ทรงพลัง
- ป้องกันการออกก่อนเวลาในตลาดที่มีแนวโน้ม
- เคารพโครงสร้างตลาดแทนระยะทางที่กำหนดโดยอัตโนมัติ
การแสดงผลภาพที่ชัดเจน
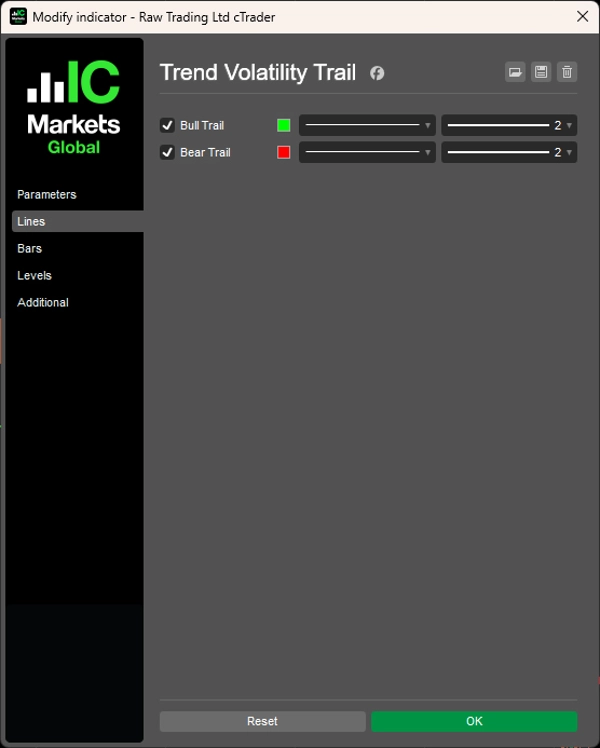
- แสดงเฉพาะเส้นตามหลังที่ใช้งานอยู่ (กระทิงหรือหมี)
- การนำเสนอกราฟที่ไม่รก
- การยืนยันแนวโน้มด้วยภาพที่ชัดเจน
- อ่านง่ายในพริบตา
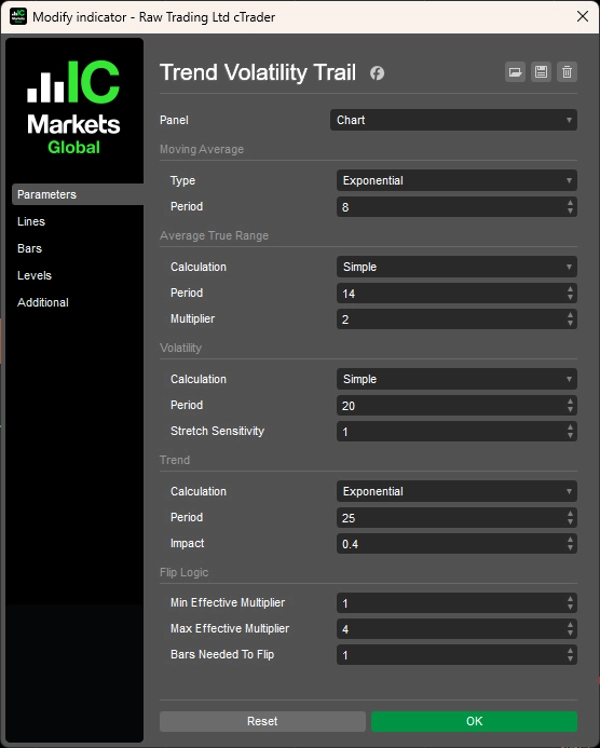
ปรับแต่งได้สูง
- ควบคุมประเภท MA ได้เต็มที่
- พารามิเตอร์ความไวที่ปรับได้
- กำหนดความต้องการการยืนยันได้
- ปรับแต่งให้ตรงกับสไตล์การเทรดของคุณ
สามส่วนประกอบปรับตัว
- Volatility Stretch: ขยายเส้นตามหลังเมื่อความผันผวนเพิ่มขึ้น
- Trend Boost: เพิ่มพื้นที่ในช่วงการเคลื่อนไหวที่แข็งแกร่ง
- Regime Confirmation: ยืนยันการเปลี่ยนแปลงแนวโน้ม
แนวคิดและวิธีการต้นฉบับได้รับการปรับจากตัวชี้วัด "Trend Following Volatility Trail" โดย HDAlgos.
__________________________________________________________________________________________
ตัวชี้วัดฟรีเพิ่มเติม
สำรวจเครื่องมือวิเคราะห์ตลาดหลากหลายประเภท — ตั้งแต่โครงสร้างและปริมาณไปจนถึงการถดถอย ความผันผวน และกรอบเวลาที่กำหนดเอง
ซอร์สโค้ดมีให้บน GitHub repository.
ทั้งหมดใช้ฟรี แต่ถ้าคุณต้องการสนับสนุนด้วยกาแฟ คุณสามารถส่งได้ ที่นี่.
แนวรับ/แนวต้าน
ปริมาณ
- Volume Activity Profiler
- Volume Efficiency Analyzer
- Volume Profile Analytics
- Volume Profile - Updated
- Volume Spread Analysis
- VWAP (Volume Weighted Average Price)
ค่าเฉลี่ยเคลื่อนที่
- SSL Channel
- Anchored Moving Average
- Deviation-Scaled Moving Average
- Gann High Low Activator
- Instantaneous Trendline
- Kaufman Adaptive MA with Trend Vision
- Moving Average Channel
- Moving Averages Suite
- Trend Channel Moving Average
ยูทิลิตี้/กำหนดเอง
แบบถดถอย
ความผันผวน
ออสซิลเลเตอร์
__________________________________________________________________________________________
ข้อจำกัดความรับผิดชอบ
การเทรดมีความเสี่ยง ตัวชี้วัดนี้มีไว้สำหรับการวิเคราะห์ทางเทคนิคเท่านั้น — โปรดใช้การจัดการความเสี่ยงที่เหมาะสมและเทรดอย่างรับผิดชอบเสมอ
ข้อเสนอแนะ & การปรับปรุง
หากคุณมีข้อเสนอแนะ คำขอคุณสมบัติ หรือไอเดียสำหรับการปรับปรุง โปรดแสดงความคิดเห็นในแท็บ Discussion ข้อเสนอแนะของคุณช่วยปรับปรุงตัวชี้วัดสำหรับทุกคน
สรุป
Key features include real-time volatility adaptation, regime detection with confirmation logic to identify bull and bear trends and filter false signals, and trend memory that incorporates directional momentum to provide additional room during strong moves. The indicator combines three adaptive components—Volatility Stretch, Trend Boost, and Regime Confirmation—to deliver structurally aware stop management.
The visual display is streamlined, showing only the active trail (bull or bear) for clear trend confirmation without chart clutter. Users can customize moving average types, sensitivity parameters, and confirmation requirements to tailor the indicator to their trading style.
This indicator supports traders targeting sustained trends by providing dynamic, market-responsive trailing stops that respect market structure and volatility changes. It is intended for technical analysis and includes a disclaimer advising responsible trading and risk management.


