
Penerangan
VERSI TERKINI PROFIL VOLUM
Berbanding dengan versi sebelumnya, versi terkini ini merangkumi pembaikan pepijat penting, ciri baru, dan peningkatan prestasi yang ketara:
Pembaikan
- Pembahagian volum diperbaiki: peruntukan berkadar berdasarkan pertindihan lilin dan bukannya 100% kepada semua tahap yang disentuh
- Pengesanan VAH/VAL diperbaiki: toleransi berskala dengan ketinggian tahap dan bukannya nilai tetap
- Penempatan teks diperbaiki: offset berdasarkan jangka masa dinamik dan bukannya hari tetap
- Pengesahan TarikhMasa diperbaiki: pemeriksaan bar kosong, pengesahan di luar julat
Ciri-ciri
- Parameter Offset Zon Masa ditambah untuk profil TarikhMasa
- Parameter Kedudukan Teks (Kiri/Kanan) ditambah untuk mod lihat semula
- Label mod TarikhMasa kini mengikuti tepi bar (lebar berubah) atau selari di tepi profil (lebar penuh)
Prestasi
- Carian binari untuk pencarian indeks TarikhMasa (sebelumnya linear O(n))
- Pengiraan jumlah volum disimpan dalam cache (sebelumnya dikira semula setiap tahap)
- Kamus TPO yang telah dipra-saiz untuk mengelakkan penyesuaian saiz
- Corak TryGetValue untuk pencarian kamus
- Gelung berasaskan indeks menggantikan foreach dalam laluan panas
Pembersihan
- Parameter ProfileWidth dibuang (pengiraan automatik sentiasa betul)
- Persimpangan lilin dipermudahkan kepada satu syarat
__________________________________________________________________________________________
NOTA PENTING - BACA DULU
Volum Forex BUKAN Volum Sebenar
Volum dalam forex adalah volum tik — ia mengira berapa kali harga berubah. Ia TIDAK mengira berapa banyak wang yang diperdagangkan.
Apa Yang Volum Tik Tidak Boleh Tunjukkan
- Saiz dagangan. Dagangan $100 dan dagangan $10,000,000 kedua-duanya dikira sebagai 1 tik.
- Aliran wang sebenar. Anda tidak dapat melihat sama ada wang besar atau kecil yang menggerakkan harga.
- Kecairan sebenar. Anda tidak dapat melihat berapa banyak pesanan yang menunggu di pasaran.
- Aktiviti bank. Bank melihat data volum sebenar. Anda tidak.
Apa Maksud Ini
Volum tik hanya menunjukkan berapa kerap harga berubah — bukan wang di sebaliknya. Ini menimbulkan masalah:
- Anda tidak dapat mengesan bank atau institusi. Mereka menggunakan data volum sebenar yang anda tidak mempunyai akses.
- Anda tidak dapat membuktikan teori "wang pintar". Idea itu memerlukan volum sebenar, bukan kiraan tik.
- Anda tidak dapat menilai kecairan sebenar. Aktiviti tik tidak menunjukkan kedalaman pesanan atau kekuatan pasaran sebenar.
- Anda tidak dapat mengukur kuasa beli atau jual sebenar. Banyak dagangan kecil kelihatan sama seperti satu dagangan institusi besar.
- Lonjakan volum boleh menipu. Lonjakan mungkin hanya bunyi algoritma, bukan minat dagangan sebenar.
Cara Menggunakan Penunjuk Ini Dengan Betul
- Anggap ia sebagai meter aktiviti, bukan meter wang. Volum tik tinggi = pasaran sibuk. Volum tik rendah = pasaran tenang. Tiada yang lebih.
- Bandingkan aktiviti antara masa yang berbeza. Gunakan untuk melihat: Adakah sesi London lebih sibuk daripada New York? Adakah hari ini lebih aktif daripada semalam? Adakah tempoh tren lebih sibuk daripada konsolidasi?
- Gabungkan dengan struktur harga. Gunakan sokongan/rintangan, titik ayunan, atau BOS/ChoCH bersama volum. Konteks harga mengelakkan isyarat palsu daripada lonjakan volum yang bising.
- Perhatikan aktiviti di tahap harga penting. Apabila harga menguji tahap utama dan volum tik meningkat, ia bermakna lebih ramai pedagang aktif. Ia TIDAK bermakna pemain besar terlibat.
- Jangan anggap ia menunjukkan aktiviti institusi. Volum tik tidak boleh menunjukkan pengumpulan, pesanan besar, atau "wang pintar." Gunakan hanya untuk mengukur irama dan tempo.
__________________________________________________________________________________________
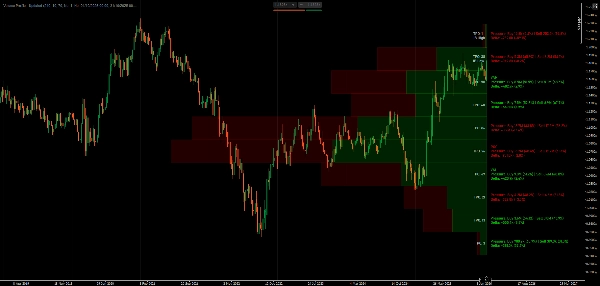
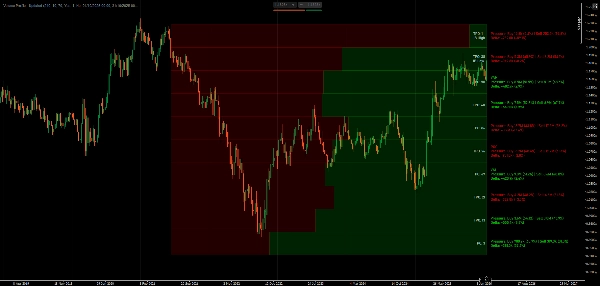
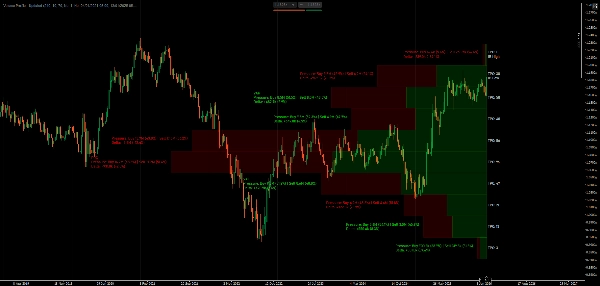
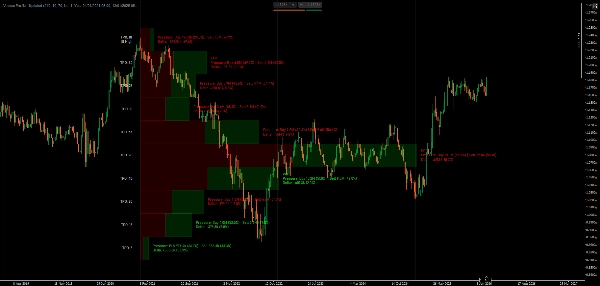
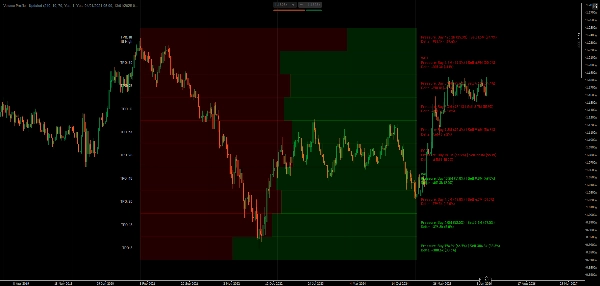
Visualisasikan pembahagian volum dan masa yang dihabiskan pada harga dengan POC, Kawasan Nilai, dan penjejakan TPO Profil Pasaran.
Penunjuk ini menunjukkan pembahagian volum menggunakan konsep Profil Pasaran. Ia memaparkan Titik Kawalan (tahap aktiviti tik tertinggi), sempadan Kawasan Nilai (di mana kebanyakan dagangan berlaku), urutan huruf TPO (masa yang dihabiskan pada setiap harga), dan visualisasi delta yang memisahkan aktiviti tik mengikut arah lilin.
Anda boleh memilih tempoh lihat semula atau menetapkan julat tarikh tertentu, memaparkan bar volum sebagai berkadar atau lebar penuh, bertukar antara semua tahap atau hanya tahap utama, dan menyesuaikan warna untuk aktiviti bullish/bearish.
CIRI-CIRI
Analisis Pembahagian Volum
- Titik Kawalan (POC): Tahap harga dengan aktiviti tertinggi—di mana harga menghabiskan masa paling banyak
- Kawasan Nilai (VA): Zon tumpuan aktiviti yang boleh disesuaikan (default 70%)—di mana kebanyakan dagangan berlaku
- VAH/VAL: Sempadan Kawasan Nilai Tinggi/Rendah—tahap sokongan/rintangan berpotensi
- Visualisasi Delta: Bar pecahan menunjukkan arah lilin pada setiap tahap harga
Profil Pasaran TPO
- Penjejakan Peluang Harga Masa: Mengira berapa banyak tempoh masa didagangkan pada setiap harga
- Huruf TPO: Representasi visual masa yang dihabiskan pada harga (urutan A-Z)
- Imbangan Awal (IB): Julat jam pertama—penting untuk struktur dagangan harian
- Penanda IB Tinggi/Rendah: Julat pembukaan ekstrem
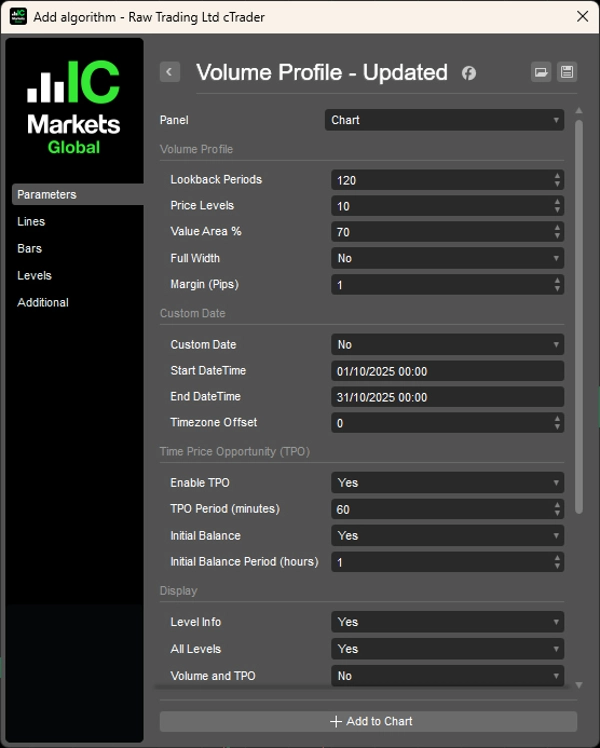
Pilihan Lihat Semula Fleksibel
- Berasaskan tempoh: Tetapkan bilangan bar untuk dianalisis (contoh, 120 bar terakhir)
- Julat TarikhMasa: Jangkar profil antara tarikh/masa tertentu untuk analisis acara
- Lebar dinamik: Profil skala automatik atau lebar tetap
Pilihan Paparan
- Bar Volum: Lebar berkadar (skala aktiviti) atau bar seragam lebar penuh
- Pecahan arah lilin dalam setiap bar
- Pengiraan delta dengan peratusan
- Togol semua tahap atau hanya tahap utama (POC, VAH, VAL)
- Kawalan keterlihatan butiran Volum/TPO
- Pecahan arah dengan peratusan
- Saiz fon boleh laras dan margin berasaskan pip
Penyesuaian Warna
- Warna bebas untuk bar arah bullish/bearish
- Warna teks berasingan untuk delta positif/negatif
- Warna teks khusus TPO
Prestasi Dioptimumkan
- Pencarian masa dalam cache dan lukisan segi empat tepat yang cekap
- Pengiraan semula minimum untuk prestasi lancar
- Pengiraan delta tahap profesional berdasarkan struktur lilin
__________________________________________________________________________________________
LAGI PENUNJUK PERCUMA
Terokai pelbagai alat analisis pasaran—daripada struktur dan volum kepada regresi, volatiliti, dan jangka masa tersuai.
Kod sumber tersedia di repositori GitHub .
Semua percuma untuk digunakan. Tetapi jika anda ingin menyokong dengan kopi, anda boleh salurkan di sini.
Sokongan/Rintangan
Volum
- Profiler Aktiviti Volum
- Penganalisis Kecekapan Volum
- Analitik Profil Volum
- Profil Volum - Dikemaskini
- Analisis Sebaran Volum
- VWAP (Harga Purata Berwajaran Volum)
Purata Bergerak
- Saluran SSL
- Purata Bergerak Berjangkar
- Purata Bergerak Skala Penyimpangan
- Pengaktif Tinggi Rendah Gann
- Garis Tren Segera
- Purata Bergerak Adaptif Kaufman dengan Visi Tren
- Saluran Purata Bergerak
- Suite Purata Bergerak
- Purata Bergerak Saluran Tren
Utiliti/Tersuai
Berasaskan Regresi
Volatiliti
Osilator
__________________________________________________________________________________________
PENAFIAN
Perdagangan melibatkan risiko. Penunjuk ini bertujuan untuk analisis teknikal sahaja — sentiasa gunakan pengurusan risiko yang betul dan berdagang dengan bertanggungjawab.
MAKLUMBALAS & PENAMBAHBAIKAN
Jika anda mempunyai cadangan, permintaan ciri, atau idea untuk penambahbaikan, sila tinggalkan komen di tab Perbincangan. Maklumbalas anda membantu memperbaiki penunjuk untuk semua orang.
Ringkasan
Key features include customizable lookback periods based on bar count or specific date/time ranges, dynamic or fixed profile widths, and display options for proportional or full-width volume bars. Users can toggle visibility of all levels or key levels (POC, VAH, VAL) and adjust colors independently for bullish/bearish bars and delta text. The indicator tracks Initial Balance (IB) ranges and marks IB High/Low for day trading structure.
Performance optimizations include binary search for DateTime lookups, cached volume calculations, and efficient data structures to minimize recalculations. The indicator uses tick volume, which counts price changes rather than actual traded volume, making it suitable as a market activity meter rather than a measure of real money flow or liquidity.
Supported markets include Forex, Indices, Commodities, Crypto, and Stocks. The indicator is intended for technical analysis and includes parameters for timezone offset and text positioning.
Ulasan pelanggan
5 | 100 % | |
4 | 0 % | |
3 | 0 % | |
2 | 0 % | |
1 | 0 % |


![Logo "High-Low Divergence [Iridio Capital]"](https://cdn.ctrader.com/image/webp/443c4661-7abb-40f1-842f-4b6ec560649b_40914)


