الوصف
نظرة عامة
الأساس: مبادئ ويكوف
تم بناء هذا المؤشر على مفهومين مكملين من منهجية ويكوف:
1. الجهد مقابل النتيجة
تنص مبدأ ويكوف الأساسي على أن حركة السعر (النتيجة) يجب أن تكون متناسبة مع الحجم الذي يقف وراءها (الجهد). عندما يكون الجهد والنتيجة في تناغم، يتصرف السوق بشكل طبيعي. عندما ينحرفان، يشير ذلك إلى نقاط تحول محتملة أو قوة استمرار.
ينفذ هذا المؤشر ذلك مباشرة من خلال مقياس الكفاءة (النتيجة لكل وحدة جهد) وعكسه، الامتصاص (الجهد الذي لا يتحول إلى نتيجة).
2. تحليل النطاق
أكد ويكوف أيضًا على تحليل خصائص أشرطة السعر الفردية—فحص النطاق (المدى)، ومكان إغلاق السعر ضمن هذا النطاق، وما إذا كان الشريط يظهر التزامًا أو ترددًا.
ينفذ هذا المؤشر تحليل النطاق من خلال القناعة (الالتزام الاتجاهي)، نسبة الهدر (التراجع داخل الشريط)، و موضع الإغلاق (يستخدم لوضع الامتصاص في سياق التراكم أو التوزيع).
ما يفعله هذا المؤشر
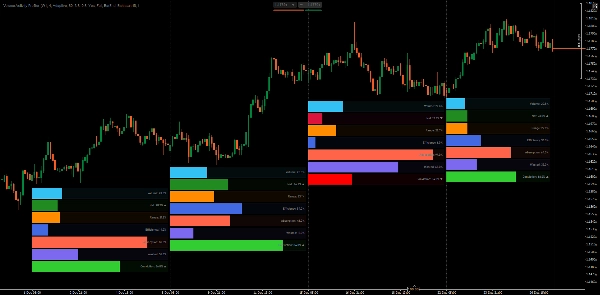
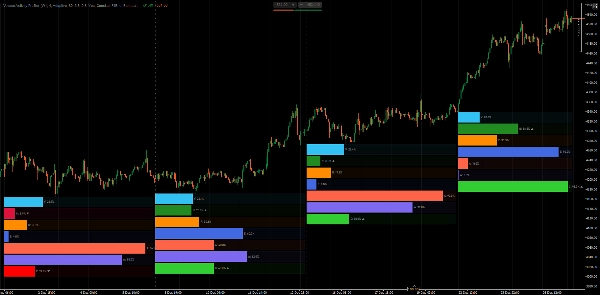
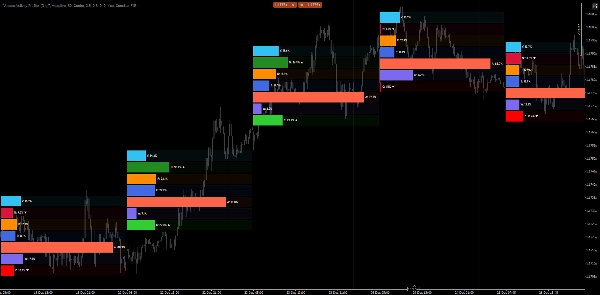
يقوم محلل نشاط الحجم بتحليل أشرطة السعر من إطار زمني محدد ويقسم نشاطها إلى مكونات قابلة للقياس. يحسب كل من المقاييس الخام والمقاييس المشتقة القائمة على النسب المئوية، ثم يعرضها كرسوم بيانية أفقية مثبتة أسفل كل شريط محلل.
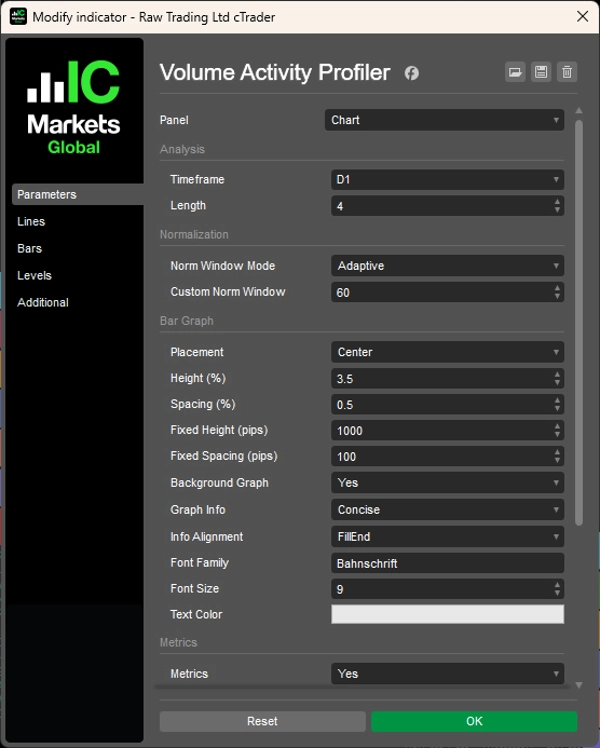
يمكنك تكوين معلمتين رئيسيتين:
- الإطار الزمني: الإطار الزمني للتحليل (مثل أسبوعي، يومي، H4)
- الطول: عدد الأشرطة التي سيتم تحليلها (مثل آخر 4 أشرطة)
بعد ذلك، يقوم المؤشر بتحليل كل شريط ضمن هذا النطاق، حساب المقاييس وتصنيفها مقارنة ببعضها البعض وبالمعايير التاريخية.
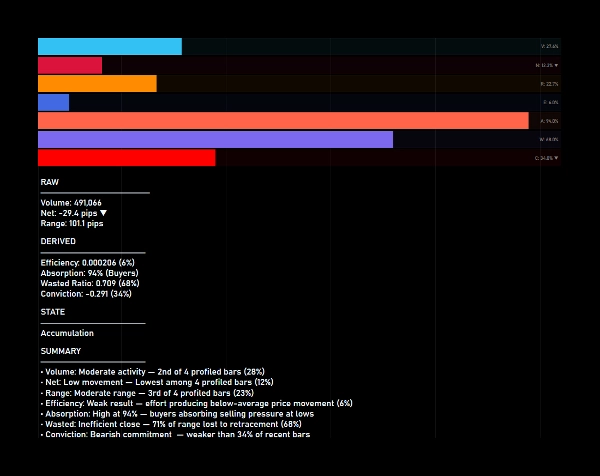
شرح المقاييس
المقاييس الخام (نسبية بين الأشرطة المحللة):
1. الحجم
حجم التيك للشريط. يظهر النسبة التي يمثلها هذا الشريط من إجمالي الحجم المحلل.
2. الصافي
الحركة الاتجاهية (الإغلاق − الافتتاح) بالبيب. يظهر نسبة الحركة الصافية الإجمالية. اللون يشير إلى الاتجاه (الأخضر = صعودي، الأحمر = هبوطي).
3. النطاق
إجمالي نطاق السعر (الأعلى − الأدنى) بالبيب. يظهر نسبة النطاق الإجمالي بين الأشرطة المحللة.
المقاييس المشتقة (مبنية على النسب المئوية مقابل النافذة التاريخية):
1. الكفاءة (الجهد مقابل النتيجة)
النطاق الناتج لكل وحدة حجم. الكفاءة العالية تعني أن الجهد يتحول إلى حركة سعرية. الكفاءة المنخفضة تشير إلى الامتصاص أو المقاومة.
2. الامتصاص (الجهد مقابل النتيجة)
عكس الكفاءة. الامتصاص العالي يشير إلى أن الحجم يتم امتصاصه دون حركة سعرية متناسبة—تراكم أو توزيع محتمل.
3. الهدر (تحليل النطاق)
نسبة النطاق المفقود بسبب التراجع (النطاق − الصافي) / النطاق. الهدر العالي يعني أن الشريط أعاد الكثير من حركته. الهدر المنخفض يشير إلى شريط نظيف واتجاهي.
4. القناعة (تحليل النطاق)
الالتزام الاتجاهي يقاس كنسبة الصافي إلى النطاق. القناعة العالية تعني أن الشريط أغلق بالقرب من أقصاه. القناعة المنخفضة تشير إلى التردد أو الرفض.
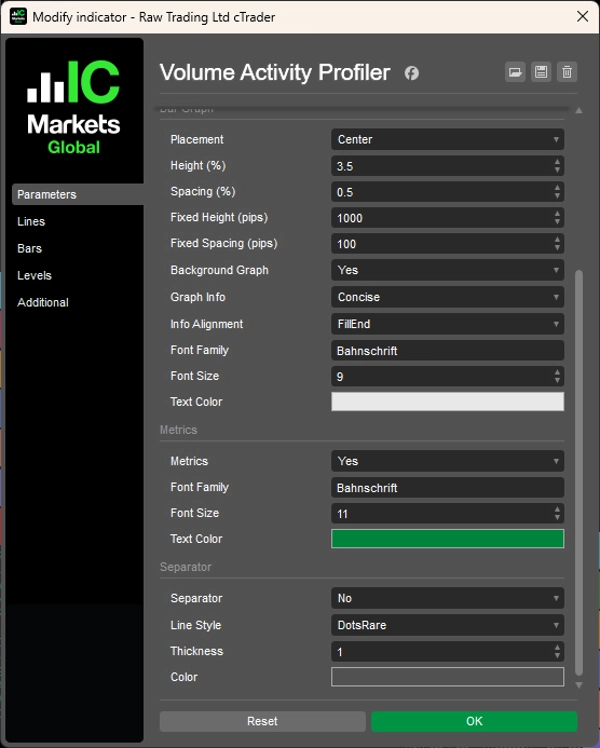
فهم الرسوم البيانية الشريطية
يعرض كل شريط محلل 7 أشرطة أفقية:
- الحجم، الصافي، النطاق — مملوءة بناءً على النسبة بين الأشرطة المحللة
- الكفاءة، الامتصاص، الهدر، القناعة — مملوءة بناءً على الترتيب المئوي مقابل البيانات التاريخية
شريط مملوء بنسبة 80% في الكفاءة يعني أن كفاءة هذا الشريط أعلى من 80% من الأشرطة في نافذة التطبيع.
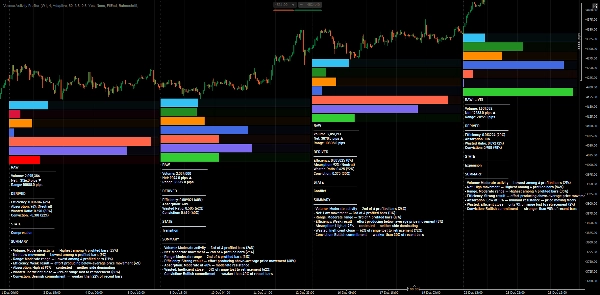
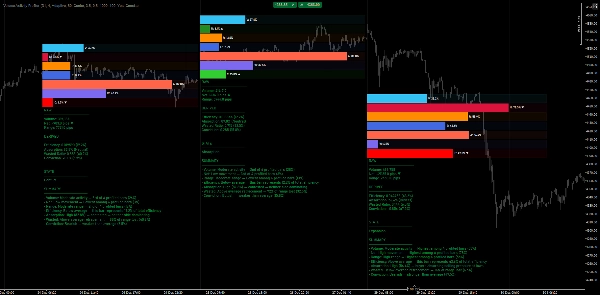
تصنيف حالة النشاط
عند تفعيل عرض المقاييس، يصنف المؤشر كل شريط إلى واحدة من هذه الحالات:
1. الانضغاط
كفاءة منخفضة + قناعة منخفضة — السعر يتجمع، طاقة محتملة تتراكم
2. التوسع
كفاءة عالية + قناعة عالية + هدر منخفض — حركة اتجاهية قوية
3. الصراع
هدر عالي + قناعة منخفضة — معركة بين المشترين والبائعين
4. التراكم
امتصاص عالي + إغلاق قرب القيعان — المشترون يمتصون ضغط البيع
5. التوزيع
امتصاص عالي + إغلاق قرب القمم — البائعون يمتصون ضغط الشراء
6. الرفض
قناعة عالية لكن إغلاق في الاتجاه المعاكس — حركة فاشلة، احتمال انعكاس
7. الانتقال
إشارات مختلطة — السوق في حالة انتقال بين الحالات
الفوائد العملية
- تقييم سريع للجهد مقابل النتيجة — رؤية فورية إذا كان الحجم ينتج حركة متناسبة أو يتم امتصاصه.
- تحليل هيكل متعدد الأطر الزمنية — تحليل أشرطة الإطار الزمني الأعلى أثناء البقاء على إطار التنفيذ الخاص بك.
- تحديد التراكم/التوزيع — الامتصاص العالي مع موضع الإغلاق يكشف عن أماكن نشاط اللاعبين الكبار.
- كشف الإرهاق والرفض — القناعة العالية مع موضع إغلاق معارض يحذر من انعكاسات محتملة.
- مقارنة الأشرطة بشكل موضوعي — التصنيفات والنسب المئوية تزيل الذاتية من تقييمات الحجم "العالي" أو "المنخفض".
- تأكيد الاختراقات — حالة التوسع مع كفاءة وقناعة عالية تؤكد اهتمام الاختراق الحقيقي.
حجم التيك كبديل للجهد
يستخدم هذا المؤشر حجم التيك كمدخل للجهد. في الفوركس، يمثل حجم التيك تكرار تغير السعر بدلاً من الحجم الفعلي المتداول—وهي محدودية معروفة في الأسواق اللامركزية.
على الرغم من ذلك، يخدم حجم التيك بفعالية كبديل للجهد لأن:
- يعكس النشاط النسبي للسوق بين الأشرطة
- عدد التيكات العالي يشير إلى زيادة مشاركة المشاركين
- علاقة الجهد مقابل النتيجة ثابتة—النشاط العالي مع حركة قليلة لا يزال يشير إلى الامتصاص
تبقى تصنيفات النسب المئوية والمقارنات بين الأشرطة صالحة طالما كانت البيانات متسقة.
ملاحظات
- يستخدم المؤشر نوافذ تطبيع تكيفية بناءً على الإطار الزمني عند ضبطه على الوضع التكيفي، مما يضمن سياقًا تاريخيًا ذا صلة.
- تُحدث حسابات النسب المئوية فقط على الأشرطة المكتملة لتجنب قراءات غير مستقرة على الأشرطة التي تتشكل.
- الشريط الحالي الذي يتشكل موسوم بـ [LIVE] في لوحة المقاييس.
__________________________________________________________________________________________
مزيد من المؤشرات المجانية
استكشف مجموعة واسعة من أدوات تحليل السوق—من الهيكل والحجم إلى الانحدار، التقلب، والأطر الزمنية المخصصة.
رمز المصدر متاح على GitHub المستودع.
جميعها مجانية للاستخدام. ولكن إذا رغبت في دعم القهوة، يمكنك توجيه الدعم هنا.
الدعم/المقاومة
الحجم
- محلل نشاط الحجم
- محلل كفاءة الحجم
- تحليلات ملف الحجم
- ملف الحجم - محدث
- تحليل انتشار الحجم
- VWAP (متوسط السعر المرجح بالحجم)
المتوسطات المتحركة
- قناة SSL
- المتوسط المتحرك المثبت
- المتوسط المتحرك بمقياس الانحراف
- مفعّل جان العالي والمنخفض
- خط الاتجاه اللحظي
- متوسط كوفمان التكيفي مع رؤية الاتجاه
- قناة المتوسط المتحرك
- مجموعة المتوسطات المتحركة
- متوسط قناة الاتجاه المتحرك
الأدوات المساعدة/المخصصة
مبني على الانحدار
التقلب
المذبذبات
__________________________________________________________________________________________
إخلاء المسؤولية
التداول ينطوي على مخاطر. هذا المؤشر مخصص للتحليل الفني فقط — دائماً طبق إدارة مخاطر مناسبة وتداول بمسؤولية.
التعليقات والتحسينات
إذا كانت لديك اقتراحات أو طلبات ميزات أو أفكار لتحسين، يرجى ترك تعليق في تبويب النقاش. تساعد ملاحظاتك في تحسين المؤشر للجميع.
الملخص
The indicator profiles price bars over a user-selected timeframe and length, calculating raw metrics such as Volume (tick volume proportion), Net (directional price movement), and Range (price range). It also derives percentile-based metrics including Efficiency (price movement per volume unit), Absorption (volume without proportional price change), Wasted Ratio (retracement within the bar), and Conviction (directional commitment).
These metrics are visually represented as horizontal bar graphs beneath each analyzed bar, facilitating objective comparison and historical context. The indicator classifies bars into activity states like Compression, Expansion, Conflict, Accumulation, Distribution, Rejection, and Transition, aiding in identifying market phases and potential turning points.
Volume Activity Profiler uses tick volume as an effort proxy, reflecting relative market activity. It supports multi-timeframe analysis and updates percentile rankings on completed bars to ensure stable readings. This tool assists traders in assessing volume efficiency, spotting accumulation/distribution, confirming breakouts, and understanding market structure through quantitative volume and price bar analysis.
تقييمات العملاء
5 | 100 % | |
4 | 0 % | |
3 | 0 % | |
2 | 0 % | |
1 | 0 % |