
Beschreibung
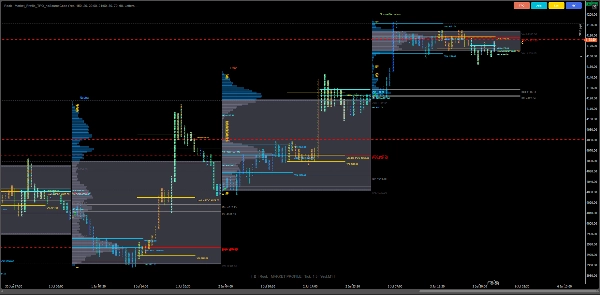
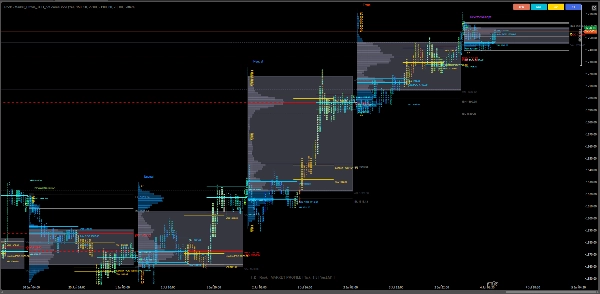
Market Profile TPO (Time Price Opportunity) bringt eine Visualisierung der Marktstruktur in institutioneller Qualität zu cTrader — und ermöglicht es Tradern, zu sehen, wie Preis, Zeit und Volumen über Sitzungen hinweg in einer intelligenten Ansicht zusammenwirken.
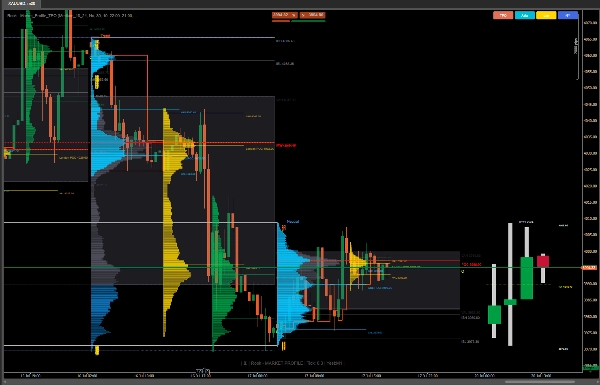
Entwickelt für professionelle Daytrader, Auktionmarktanalysten und Orderflow-Enthusiasten liefert dieser Indikator eine wahre Darstellung der Marktaktivität mithilfe von TPO-Buchstaben, Boxen und Histogrammen. Er hilft Ihnen, Wertbereiche, POC-Zonen, Initial Balance Bereiche und nackte Levels mit höchster Genauigkeit zu identifizieren.
⚙️ Kernfunktionen
✅ (TPO) Visualisierung
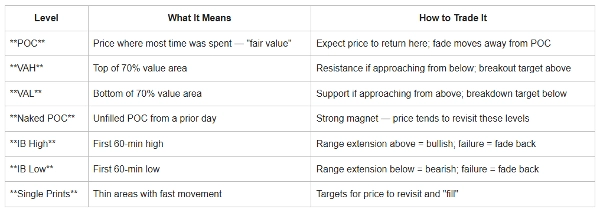
✅ POC- & Wertbereichszonen
✅ Entwickelnder POC
✅ Initial Balance (IB) Erkennung
✅ Sitzungs- & Zeitzonenintelligenz
✅ TPO-Anzeigemodi (Buchstaben / Histogramm)
✅ Open/Close Preis-Markierungen (O/X)
✅ Einzelne Prints & nackte POC/VA-Level
✅ Tages- & Vortages-OHLC-Overlay
✅ Tages- & Vortages-OHLC-Overlay
✅ HTF Balkenprojektion (AMD)
Wesentliche Verbesserungen
✔ Schnellere Ladezeiten
✔ Bessere Speicherverwaltung
✔ Präzise Wertbereichsberechnung
✔ Korrekte Positionierung des Sitzungsprofils
✔ Verbesserte Umschaltleistung
✔ Plattformübergreifende Kompatibilität
✔ UTC-basierte Sitzungen (keine automatische Sommerzeit)
✔ Verbesserte Handhabung nackter POC
✔ Verbesserte Profildarstellung
🧭 Anwendungsfälle im Trading
🔹 Intraday-Auktionsanalyse — Erkennen, wo sich Werte bilden, verschieben oder brechen.
🔹 POC- & Wertumkehr-Trades — Zielgerichtete Gleichgewichtsnachtests oder das Auslaufen von Extremen.
🔹 Initial Balance Ausbrüche — Erkennen, wenn die Sitzung über ihre erste Stunden-Spanne hinauswächst.
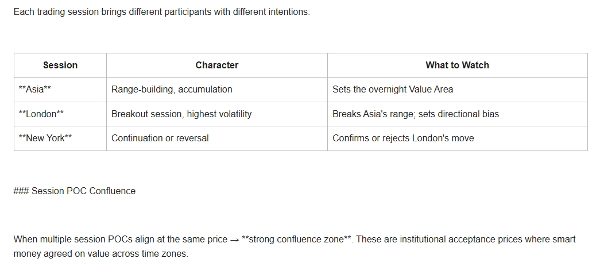
🔹 Sitzungsrotationsstudie — Vergleich von Profilen über die Sitzungen in Asien, London und New York mit Zeitzonenausrichtung.
🔹 Aufbau institutioneller Kontexte — Kombination mit Volumen- oder Delta-Tools zur Validierung von Smart-Money-Spuren.
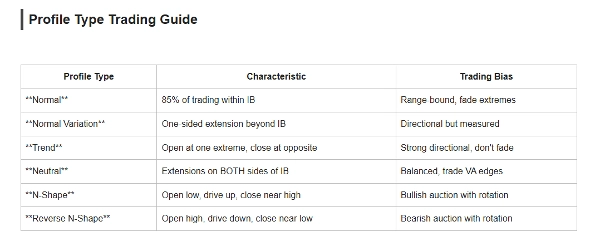
Profiltypen
Typ Marktbedingung
Normal Ausgewogener Markt
Normale Variation Moderater Trend
Trend Starker Richtungs-Tag
Neutral Zweiseitige Auktion
N-Form Bullische Auktion
Umgekehrte N-Form Bärische Auktion
Ideal für
- Auction Market Theory (AMT)
- Market Profile Trader
- Intraday-Trader
- Swing-Trader
- Futures-Trader
- Forex-Trader
- Professionelle Orderflow-Analyse
Bringen Sie institutionelle Klarheit in Ihre Charts.
Der Market Profile TPO Indikator verwandelt rohe Preisdaten in eine Geschichte von Wert, Ungleichgewicht und Gelegenheit
Haftungsausschluss: Dieser Indikator wird nur zu Bildungs- und Informationszwecken bereitgestellt und stellt keine Finanz-, Investitions- oder Handelsberatung dar. Market Profile ist ein analytisches Werkzeug und garantiert keine Gewinne oder zukünftigen Ergebnisse.
Der Handel mit Finanzmärkten birgt erhebliche Risiken, und vergangene Leistungen garantieren keine zukünftigen Ergebnisse. Nutzer sind allein verantwortlich für ihre Handelsentscheidungen, Risikomanagement und daraus resultierende Gewinne oder Verluste.
Führen Sie stets Ihre eigene Analyse durch und konsultieren Sie einen qualifizierten Finanzfachmann, bevor Sie Investitions- oder Handelsentscheidungen treffen.
Zusammenfassung
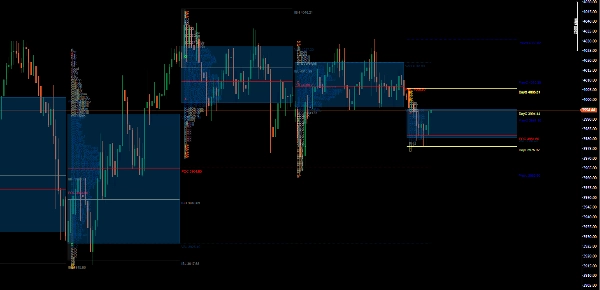
Key features include multiple TPO display modes (letters and histogram), session and timezone intelligence with UTC-based sessions, open/close price markers (O/X), single prints, naked POC/VA levels, and overlays of day and previous day OHLC data. The indicator supports analysis of various market conditions through profile types like Normal (balanced market), Normal Variation (moderate trend), Trend (strong directional day), Neutral (two-sided auction), N-Shape (bullish auction), and Reverse N-Shape (bearish auction).
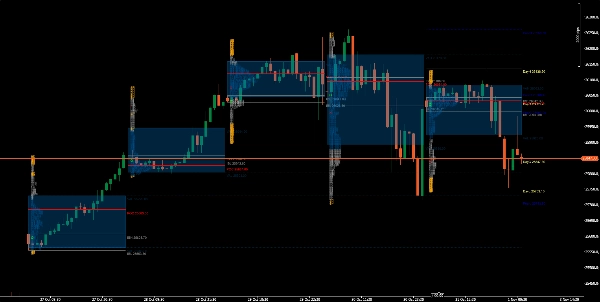
It is suitable for professional day traders, auction market analysts, order flow enthusiasts, and traders across Forex, indices, and commodities markets. Typical use cases include intraday auction analysis, POC and value reversion trades, initial balance breakouts, session rotation studies, and institutional context building when combined with volume or delta tools.
This indicator provides a detailed, structured view of market dynamics to support informed trading decisions based on Auction Market Theory and Market Profile principles.
Kundenbewertungen
5 | 0 % | |
4 | 100 % | |
3 | 0 % | |
2 | 0 % | |
1 | 0 % |


![„[Stellar Strategies] Market Session Ultimate“-Logo](https://cdn.ctrader.com/image/webp/61ffd537-0125-4246-9e72-42eca1791d64_28232)
![„Smart Money Concepts (SMC) [Iridio Capital]“-Logo](https://cdn.ctrader.com/image/webp/28b69fd1-ef54-4bed-9487-07e78e883be4_40934)


![„High-Low Divergence [Iridio Capital]“-Logo](https://cdn.ctrader.com/image/webp/443c4661-7abb-40f1-842f-4b6ec560649b_40914)


