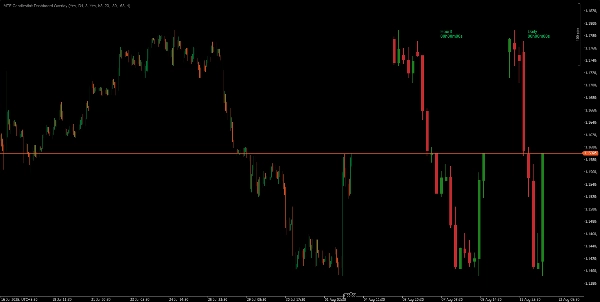
Multi_TF Candlestick Chart Overlay
„Multi_TF Candlestick Chart Overlay“-Logo
21/08/2025
1
Desktop
Seit 22/06/2025
Verkäufe
15
Kostenlose Installationen
13
In „Multi_TF Candlestick Chart Overlay“ hochgeladenes Bild

This indicator overlays bold, easy-to-read candlestick panels from two higher timeframes—fully configurable—directly on your chart. Instantly visualize higher timeframe market structure, trend, and momentum without switching charts.

Features:
• Display two customizable panels (any timeframes) side-by-side
• Real-time countdown timer for each TF’s next candle
• Clean, filled candles with bull/bear coloring and bold wicks
• User controls for panel position, size, spacing, and candle count
• Zero lag, works on any chart timeframe or symbol

Perfect for traders who demand a clear overview of multiple timeframes at a glance.

Never miss a key HTF structure shift again—see the big picture right on your trading chart!


My Other Products


Disclaimer: Trading involves risk, and past results do not guarantee future performance. Use proper risk management, follow stop-loss levels, and trade responsibly. I am not liable for any financial losses from using these algorithms.use these indicators for your confluence and reduce burden your charting markup time

0.0
Bewertungen: 0
Kundenbewertungen
Bisher gibt es keine Bewertungen für dieses Produkt. Haben Sie es schon ausprobiert? Dann können Sie die erste Person sein, die andere darüber informiert!
Mehr von diesem Autor
Tiny_Aim_Trainer
trading stress-relief “mini-game”
Indikator
NAS100
XAUUSD
Commodities
+10
MARKET_STRUCTURE BOS_CHoCH
MarketStructurePro – Smart BOS/CHoCH
Retro_Shooting_Game
trading stress-relief “mini-game”
Indikator
Indices
Commodities
Forex
Institutional FVG Zones MTF with Confluence
Professional Fair Value Gaps with multitimeframe spot on
Market_Session_Forex
Market Sessions
Indikator
NAS100
Indices
XAUUSD
+4
BSL_SSL_Liqudity
Buy-Side & Sell-Side Liquidity (BSL/SSL) Indicator
Indikator
VWAP
Breakout
Scalping
VWAP & Sessions & D,W,M HLO Levels
Killzone Session With VWAP – Precision Meets Price Action
TDI_Pro
Traders Dynamic Index (TDI) — Divergence Edition
Indikator
NAS100
XAUUSD
FVG
+11
Fair Value Gaps_FVG_MTF
Multi-TF FVG + Smart Fibonacci
VWAP_MTF
📊 VWAP with MTF & Dynamic Deviation Bands
ICT Killzones & Macros
KILLZONES AND MACRO SESSIONS
Indikator
NAS100
Indices
Breakout
+6
All-in-One Session Levels Suite
Institutional Session Levels Pro OHLC,Prev(D,W,M OHLC)
Indikator
NAS100
Indices
Prop
+6
ICT_SMC_ToolKit
institutional-level market analysis
Das könnte Sie auch noch interessieren
VegaXLR - Analysis Tools Alerts
Enhance your trading with customizable alerts and dynamic visual tools for trendlines, Fibonacci levels, and more.
Indikator
ATR
Forex
RISK V1
Automated position sizing based on risk, entry, and stop loss with ATR support and visual trade setup on charts.
Indikator
Signal
Half Trend BT
Half Trend BT by BullittTraders
AlphaTrend Pro by LudwigICT
DynamicVolumeSupplyDemand
Supply and Demand Zones
LaguerreRSI
Laguerre RSI: smoother, faster RSI with less noise. Great for spotting reversals and timing entries.
[Hamster-Coder] Pivot Points MTF
[Hamster-Coder] Pivot Points (Multi Time Frame)
Indikator
Indices
RSI
Commodities
+1
OrderPrice-V3
A straightforward yet effective tool signals entry points for both buying and selling. Include 3 Moving Average
Drawing Utility
A rectangular box with 5 adjustable Fibonacci level or even custom ones.
ADX and ADI
This custom indicator is a complete implementation of the Average Directional Index and Directional Indicators.
Indicatore utbot
L'indicatore UTBot è uno strumento di analisi tecnica che crea una linea di trailing stop dinamica basata sull'ATRT
Indikator
Grid
RSI
Breakout
+18
Logarithmic Framework by LudwigICT
Indikator
Indices
Commodities
Stocks
+2
MARainbow
MARainbow gives you the edge with four customizable moving averages—each color-coded for instant recognition.
Golden Boom And Crash Spike Detector
Golden Boom and Crash Spike Detector is a trading tool designed for Crash 300 and Boom 300 indices on M1 Timeframe.
Indikator
RSI
XAUUSD
Breakout
+4
ZScore Reversion
Z-Score: Measures price deviations from its mean. Spots overbought/sold (±2-3 SD) & reversals. Key for stats trading
Indikator
Indices
Commodities
Stocks
+2
XY Bar Info Panel v1.5
Overlay panel showing bar date/time, OHLC, tick Volume, percent change, and market session - fully customizable.
Indikator
RSI
Indices
StochasticRSI
Stochastic RSI (StochRSI) is a technical indicator used to measure the strength and weakness of the RSI.
DailyPivotPoints
Daily Pivot Points plots key support and resistance levels to guide precise trading decisions.