
설명
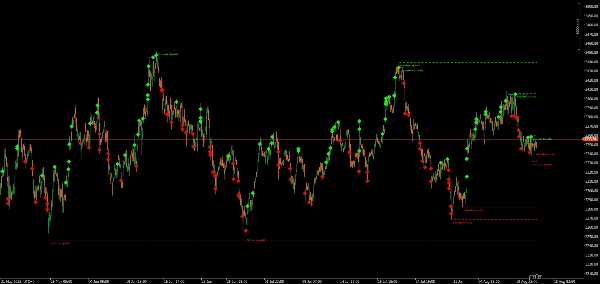
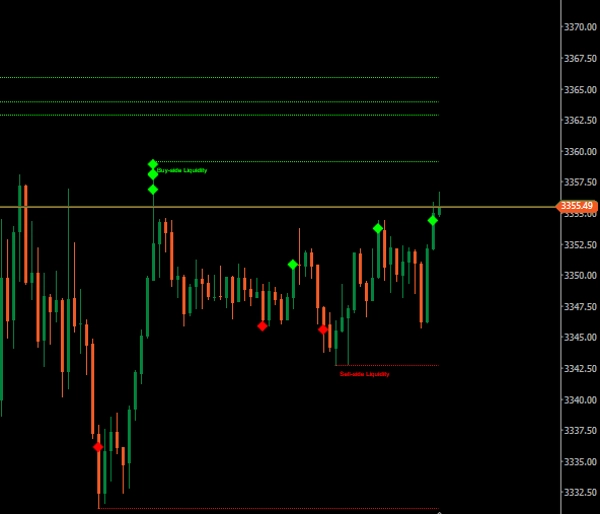
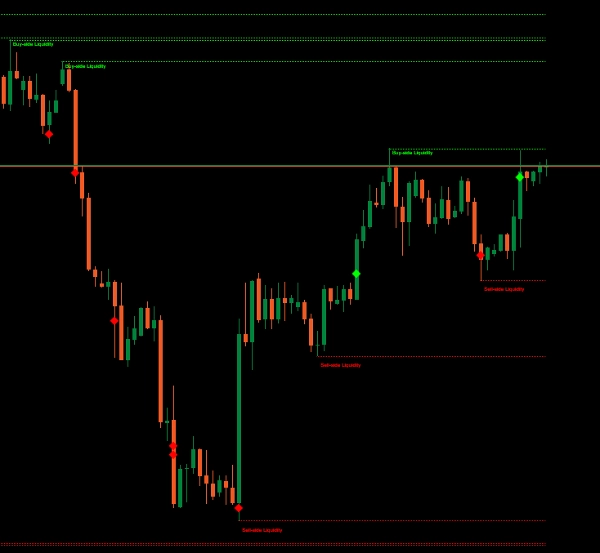
Buy-Side & Sell-Side Liquidity (BSL/SSL) 지표는 (ICT) 또는 유동성 기반 전략을 따르는 트레이더를 위해 설계되었습니다. 이 지표는 시장에서 핵심 유동성 구역을 자동으로 감지하여 스윙 고점(매수 측 유동성)과 스윙 저점(매도 측 유동성)을 강조 표시하며, 이 수준들이 청소되었는지 아니면 그대로 유지되고 있는지 모니터링합니다.
- BSL (매수 측 유동성) – 숏 포지션의 손절 주문이나 돌파 매수 주문이 모여 있을 수 있는 최근 스윙 고점을 표시합니다.
- SSL (매도 측 유동성) – 롱 포지션의 손절 주문이나 돌파 매도 주문이 위치할 수 있는 최근 스윙 저점을 표시합니다.
- 청소 표시기 – 가격이 표시된 유동성 수준을 돌파할 때, 지표는 청소를 나타내는 다이아몬드 마커를 표시합니다.
누구를 위한 것인가?
- ICT 방법론 트레이더
- 유동성 확보 / 스톱 헌팅 전략가
- 세션 기반 움직임을 목표로 하는 스캘퍼 및 데이 트레이더
- 고확률 반전 포인트를 찾는 스윙 트레이더
장점
- 시각적 명확성 – 시장이 유동성을 찾을 가능성이 있는 위치를 즉시 확인할 수 있습니다.
- 시간 효율성 – 더 이상 스윙을 수동으로 표시하고 청소 여부를 확인할 필요가 없습니다.
- 전략적 이점 – 다음과 결합하세요
- FVGs,
- 시장 구조를 활용해 거래 설정을 정교하게 만드세요.
- 세션 킬 존
- 매크로
내 다른 제품들
- Institutional FVG Zones MTF with Confluence
- All-in-One Session Levels Suite
- MARKET_STRUCTURE BOS_CHoCH
- Multi_TF Candlestick Chart Overlay
- ICT Killzones & Macros
- ICT_SMC_ToolKit
- VWAP_MTF
- Traders Dynamic Index (TDI)
- Market_Session_Forex
면책 조항: 거래에는 위험이 따르며, 과거 결과가 미래 성과를 보장하지 않습니다. 적절한 위험 관리를 사용하고, 손절 수준을 준수하며, 책임감 있게 거래하세요. 이 알고리즘 사용으로 인한 재정적 손실에 대해 저는 책임지지 않습니다. 이 지표들을 컨플루언스로 사용하여 차트 마크업 시간을 줄이세요.
요약
AI 요약
The Buy-Side & Sell-Side Liquidity (BSL/SSL) Indicator identifies key liquidity zones in the market by marking recent swing highs (Buy-Side Liquidity) and swing lows (Sell-Side Liquidity). It highlights areas where stop-loss orders or breakout orders may cluster and tracks whether these liquidity levels have been breached, displaying diamond markers to indicate sweeps. Designed for traders using ICT methodology, liquidity grab, or stop hunt strategies, it supports scalpers, day traders, and swing traders targeting session-based moves or high-probability reversal points. The indicator provides visual clarity by automatically marking liquidity zones, saving time otherwise spent manually identifying swings and sweeps. It can be combined with other tools such as Fair Value Gaps (FVGs), market structure analysis, and session kill zones to refine trade setups. Supported markets include Forex, indices, commodities, and popular symbols like BTCUSD, EURUSD, XAUUSD, and NAS100. The indicator aims to enhance strategic decision-making by clearly displaying where the market is likely to seek liquidity.
지표 프로필
고객 리뷰
4.3
리뷰: 3
5 | 33 % | |
4 | 67 % | |
3 | 0 % | |
2 | 0 % | |
1 | 0 % |
고객 리뷰
August 16, 2025
Practical account helper around smart money style analysis. The useful part is mapping zones before entries, with the numbers checked before scaling. A good sample is 20 FVG or order block reactions, with messy 0.705 areas skipped. The zone is more convincing when structure and risk both make sense.
August 15, 2025
August 15, 2025
Clean trading note if the trader wants it adds structure around liquidity, gaps and market shifts. It works best as support, not a final decision maker. For SMC logic, I trust zones more when 0.5 mitigation, BOS and liquidity sweep line up. zones still need manual validation.
상담
자주 묻는 질문(FAQ)
BTCUSD
Forex
Indices
EURUSD
Commodities
XAUUSD
NAS100
트레이딩 봇, 지표, 플러그인 등 cTrader Store에서 제공되는 상품은 제3자 개발자에 의해 제공되며, 이는 단순히 정보 및 기술적 접근을 목적으로 제공된 것입니다. cTrader Store는 중개인이 아니며, 투자 조언, 개인별 추천 또는 향후 성과에 대한 어떠한 보장도 제공하지 않습니다.
이 작성자의 상품 더 보기


가격
가입일 22/06/2025
80
판매
84
무료 설치